InfoSky: Difference between revisions
Gruppe8 SS07 (talk | contribs) No edit summary |
Gruppe8 SS07 (talk | contribs) No edit summary |
||
| Line 8: | Line 8: | ||
== Short description == | == Short description == | ||
{{Quotation|The | {{Quotation|The InfoSky visual explorer is a system enabling users to interactively explore large, hierarchically structured document | ||
collections. Similar to a real-world telescope, InfoSky employs a | |||
planar graphical representation with variable magnification. | |||
Documents of similar content are placed close to each other and | |||
displayed as stars, while collections of documents at a particular | |||
level in the hierarchy are visualised as bounding polygons. | |||
Usability testing of an early prototype implementation of | |||
InfoSky revealed several design issues which prevented users | |||
from fully exploiting the power of the visual metaphor. | |||
Evaluation results have been incorporated into an advanced | |||
prototype, and another usability test has been conducted. A | |||
comparison of test results demonstrates enhanced system | |||
performance and points out promising directions for further work.|[George Robertson et al., 1991]}} | |||
== Suitable Datatypes == | == Suitable Datatypes == | ||
Revision as of 17:49, 11 April 2007
Authors
- Michael Granitzer
- Wolfgang Kienreich
- Keith Andrews
- Vedran Sabol
- Werner Klieber
Short description
collections. Similar to a real-world telescope, InfoSky employs a planar graphical representation with variable magnification. Documents of similar content are placed close to each other and displayed as stars, while collections of documents at a particular level in the hierarchy are visualised as bounding polygons. Usability testing of an early prototype implementation of InfoSky revealed several design issues which prevented users from fully exploiting the power of the visual metaphor. Evaluation results have been incorporated into an advanced prototype, and another usability test has been conducted. A comparison of test results demonstrates enhanced system
performance and points out promising directions for further work.
Suitable Datatypes
Suitable Datatypes for this information visualization technique are hierarchical information structures.
Figures
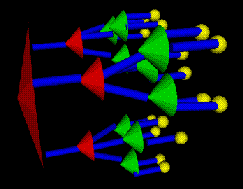
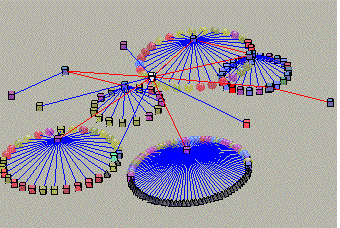
Each tree node is the apex of a cone. The children of each node are drawn around the base of its associated cone.

Examples and use cases
Layout of a simple Cone Tree [Robertson et al., 1991]
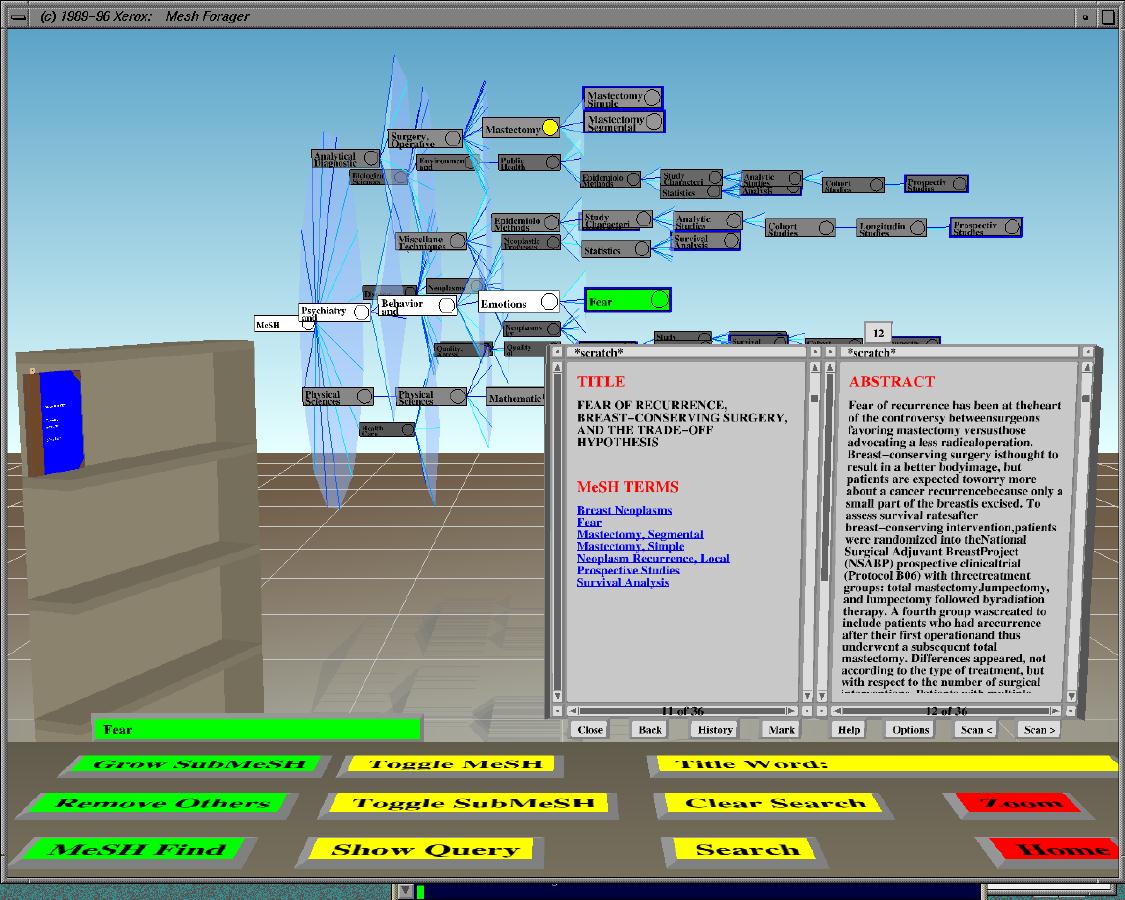
Cat-a-Cone: An Interactive Interface for Specifying Searches and Viewing Retrieval Results using a Large Category Hierarchy
[Hearst and Karadi, 1997]
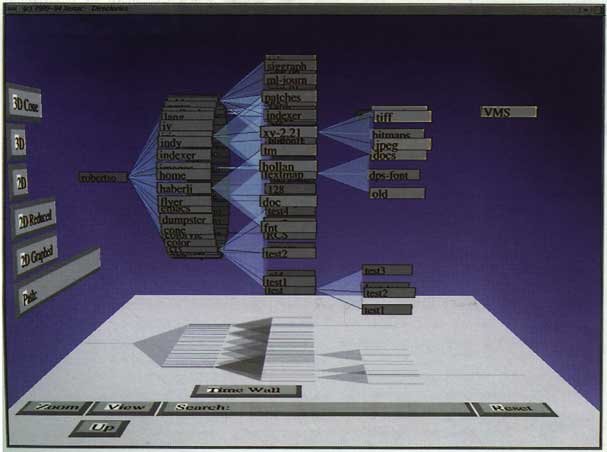
Lyberworld [Hemmje, 1994]
LyberWorld is a 3D visualization user interface supporting fulltext retrieval.
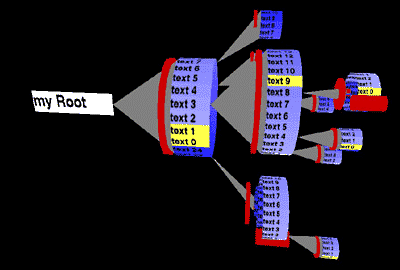
A file-system displayed as cone-tree
Evaluation
References
- [Robertson et al., 1991] George Robertson, Jock D. Mackinlay, Stuart Card. Cone Trees: Animated 3D Visualizations of Hierarchical Information. In Proceedings of the ACM CHI 91 Human Factors in Computing Systems Conference, pages 189-- 194, April 28 - June 5, 1991, New Orleans, Louisiana, June 1991. Association for Computing Machinery
Evaluation References
- [Cockburn and McKenzie, 2000] Andrew Cockburn and Bruce McKenzie. An Evaluation of Cone Trees. In People and Computers XIV: British Computer Society Conference on Human Computer Interaction 2000, p425--436. Springer-Verlag.
- [Hearst and Karadi, 1997] Marti A. Hearst and Chandu Karadi. Cat-a-Cone: An Interactive Interface for Specifying Searches and Viewing Retrieval Results using a Large Category Hierarchy. In Proceedings of the Twentieth Annual International ACM SIGIR Conference, pages 246-- 255, Philadelphia, PA, July 1997
- [Hemmje, 1994] Matthias Hemmje, LyberWorld - A 3D Graphical User Interface for Fulltext Retrieval. Created at: May 7-11 1995. Retrieved at: April 13, 2006. http://delivery.acm.org/...
