Teaching:TUW - UE InfoVis WS 2007/08 - Gruppe 01 - Aufgabe 4
Aufgabenstellung
Aufgabe ist das Design einer interaktiven Visualisierungsapplikation zur Darstellung und Exploration
(des zeitlichen Verlaufs) von Laborwerten einer Blutuntersuchung. BenutzerInnen, Einsatzzweck, Tasks, etc.
sollen von Euch selbst festgelegt und beschrieben werden.
Beispiele für derartige Datensätze
Application Area
The temporal change of laboratory values obtained by blood examinations needs to be analyzed.
Data
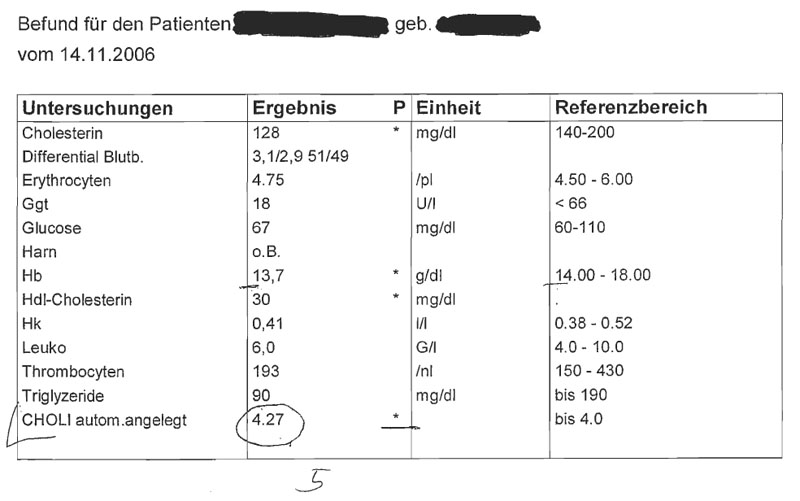
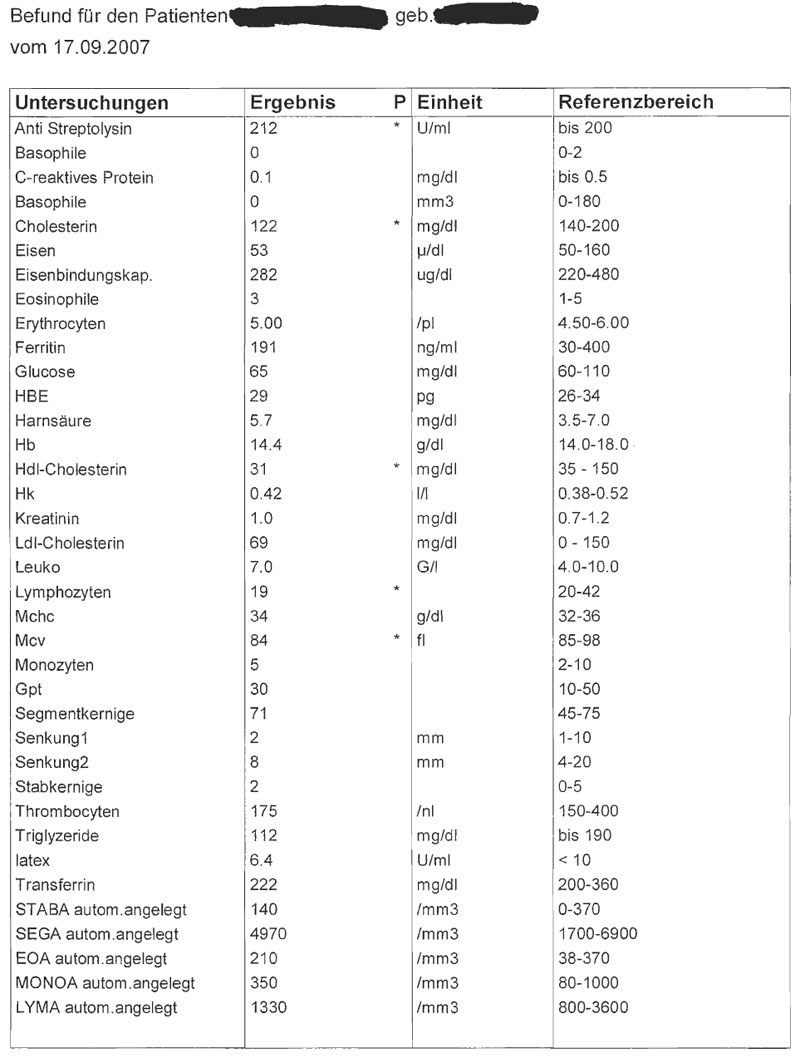
A patients blood can be examined several times. Each time, a certain set of attributes - like cholesterol or glucose - can be evaluated. Every attribute takes a discrete value and has its own unit, for example the unit for cholesterol is mg/dl. So we have 2-dimensional data, with a temporal dimension, that is hierarchically grouped by patient.
The non-critical range of values an attribute can take is known. Therefore each value can be either critical or normal. Each attribute has a lower (which can be 0) and upper boundary defining the range of normal values. Sometimes, no boundaries are specified.
Target Group
The data needs to be evaluated by physicians or nurses. They basically need to be able to see if the laboratory values are normal or critical. They also need to track changes over time, for instance to see if a certain therapy yields the desired effect. Furthermore it may be interesting to compare specific values and their change over time between a number of patients. It doesn't make sense to compare the different attribute's values to each other, but since physicians and nurses are very busy it is necessary to see them all at once to quickly scan the whole data set for interesting or possibly critical values.
Goals
To guide our design, we first define use cases we want to support and order them descending by priority (most important first).
Evaluate New Blood Examination Values
A blood examination has taken place and the user wants to quickly check the results. This can yield to the following:
- Everything is fine. The neither the system nor the user detects something critical. The user can go and make a coffee break or be very cautious and analyze the values in detail.
- The system detects a critical value and presents it accordingly to the user. The user can either draw conclusions immediately or analyze the values in detail.
- The user detects a possibly critical or interesting value, which needs to be analyzed in detail. The possibilities here are manifold: The user may needs to compare different attributes as well as patients or historical values as well as any combination of these. In other words, exploration must be easy and should be encouraged.
View Blood Examination History
The user can gain more insights from laboratory values when examining them in comparison to historical values. This is part of a detailed analyzation and therefore the system does not need to give an overview of the history of all attributes at once, but rather lets the user choose single or multiple attributes to examine in detail and possibly compare over time.
Compare Patients
It may be interesting to compare the laboratory values of two or more patients. This can be done for specific laboratory values at a given moment or for a given interval.
Design
The user interface is divided into 4 parts:
Patients
The user chooses at least one patient to look at. If more than one is chosen, one of them is the primary patient, which is to be compared with the other patients. By clicking on a patient, it can be made the primary one.
Timeline
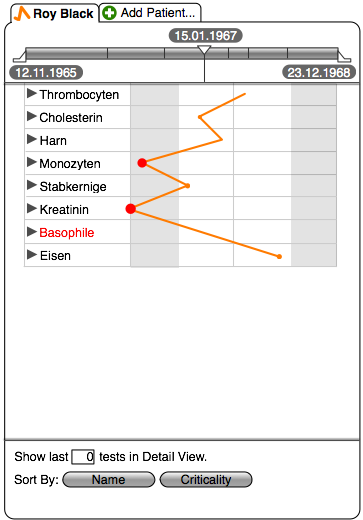
The timeline represents the interval between the first and the last blood examination of the primary patient. Each blood examination is depicted by a vertical line. One of the blood examinations can be selected by dragging the white triangle near its position in the timeline. The selected blood examination is also highlighted by a longer vertical line that also establishes a connection to the History View.
The timeline can also act as a range slider with two handles to reduce the displayed interval in the History View, although this is only necessary if the number of blood examinations exceeds a certain limit.
Single Blood Examination View
This view displays the examination selected in the timeline. To present the results of a blood examination at a given point in time and make a quick evaluation of all attributes at once easy, we use a 'Parallel Coordinates' visualization. Here, the values of the different attributes are normalized between the specific lower and upper boundaries of each attribute. This helps the user to quickly spot the normalcy of a whole set of laboratory values - the straighter and more centered the line is, the better the blood values are. To make the distinction between critical and normal values clear, the background of the normal range is different from the background of the critical range. This support can be enhanced by adding points to each connection, where its size reflects the criticality of the given value. The point can also turn red, when the value lies outside the non-critical range. When no critical range is specified, the visual distinction should be omitted, the line should be drawn to the center but the value must be highlighted to draw attention and encourage further examination.
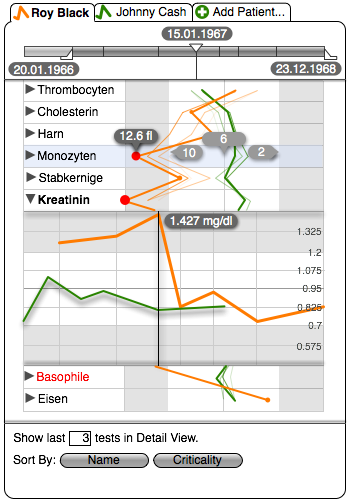
The view can be configured to also display a certain number of blood examinations in history, e.g. the last 3 blood examinations before the selected one. The older the examination is, the thinner and more transparent its representing line gets. This gives the visualization a spatial look and supports tracking changes over time.
The view can display more than one patients, where each patient is identified by a unique color. The primary patient is highlighted and displayed above the other patients. As the dates where blood examinations have been conducted can vary between patients, the test results must be selected for each patient. The default values to display may be the values of the latest blood examination. The displayed test can be selected by clicking on a patient thus making her the primary patient and moving the triangle in the timeline to the desired date. Another possibility is to simply click one of the lines representing a blood examination before the selected test. When the selected test of the primary patient is changed, the selected tests of all other patients stay the same, of course.
Attributes can be reordered by drag and drop, to enable the user to place desired attributes side-by-side for easier comparison.
Attributes can also be highlighted to display detailed information about its value, upper and lower boundary for normal values and its midpoint.
Attributes with missing values are highlighted using red color to draw attention.
History View
When the history of conducted blood examinations needs to be examined, the History View can be made visible by clicking the disclosure triangle on the left side of each attribute. After clicking the triangle a little animation starts. The bar (in this case with two values) is copied, turned vertical and all the additional values are added from the left and the right side, to make it easier to recognize the now different dimension of the data.
The History View is basically a line graph where the x-axis represents the time selected in the timeline and the y-axis the laboratory values. As in the Single Blood Examination View the non-critical range of values is optically separated from the critical range. In addition, labelled vertical lines partition the y-axes and help determining unlabeled values. Light vertical lines are drawn for each blood examination of the primary patient.
The selected blood examination displayed in the Single Blood Examination View and selected in the timeline is highlighted by a strong line which can be dragged to change the selected blood examination. The actual value of the selected attribute is also displayed.
Lines depicting the values of non-primary patients can be dragged to compare them with the selected blood examination of the primary patient.
Visualization Controls
The visualization can be modified here. The user can set the number of tests to display in the detail view. Furthermore, the attributes can automatically be sorted by name or criticality.


