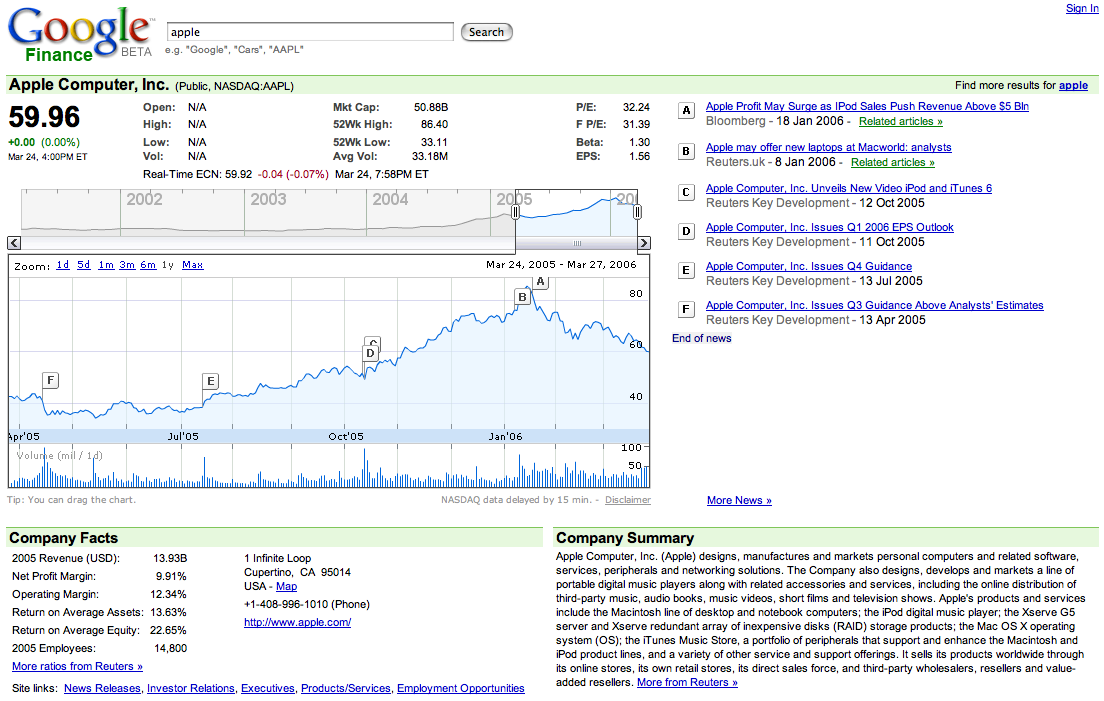
2006-03-27: Google Finance - Interactive Flash graphs to explore stock price data
Jump to navigation
Jump to search

[Google, 2006]
Interactive Flash graphs that combine stock price data in form of Line graphs (top) and sold volumes via Spike graphs (bottom). The data can be explored interactively providing Details on demand for each day; navigation can be performed via dragging the chart by mouse or moving the top Overview-plus-Detail slider. The current level of detail can be determined by dragging the overview window or selecting predefined granularities. Furthermore, company news are related to time by placing flags along the price chart.
Details: http://finance.google.com
via information aesthetics blog
References
[Google, 2006] Google, Finance BETA, Retrieved at: March 27, 2006. http://finance.google.com