Teaching:TUW - UE InfoVis WS 2007/08 - Gruppe 06 - Aufgabe 3: Difference between revisions
No edit summary |
(Exercise 03) |
||
| Line 11: | Line 11: | ||
*Visual means to highlight data is split into two possibilities. You could visual data as greater or you could use contrasting visual data. But in our example the trying of highlight any data is failing. | *Visual means to highlight data is split into two possibilities. You could visual data as greater or you could use contrasting visual data. But in our example the trying of highlight any data is failing. | ||
''Was meint ihr damit konkret? Präzisieren.'' | |||
*The Label – what it is, when it is and who produced it, should stand in the title of the graphic. In our example there is something like a title but very small at the end of the graphic. Even more there is no explaining of the coherence between private credits and public debts. | *The Label – what it is, when it is and who produced it, should stand in the title of the graphic. In our example there is something like a title but very small at the end of the graphic. Even more there is no explaining of the coherence between private credits and public debts. | ||
''Wenn ihr mit Titel "Private Kredite & öffentliche Schulden in der Bundesrepublik Deutschland" meint; <br>das ist meine Beschriftung der Abbildung im Wiki. Es gibt definitiv keinen Titel hier.'' | |||
*The headlines and the explaining notes have a bad position. For example the note: “Schätzung”, is definitely on the wrong position. It gives you the impression that it is only guilty for this core. | *The headlines and the explaining notes have a bad position. For example the note: “Schätzung”, is definitely on the wrong position. It gives you the impression that it is only guilty for this core. | ||
''Da der Zeitpunkt der Erhebung der Daten nicht angegeben ist (was der Fall sein sollte), kann nicht eindeutig gesagt werden, <br>ob Schätzung sich auf alle Balken, oder nur auf den 1997er bezieht. Ich würde aber auf Grund der Position auf letzteres tippen.'' | |||
*It is hard to compare the data because of the values in different years. The timeline is not complete. | *It is hard to compare the data because of the values in different years. The timeline is not complete. | ||
''Es gibt eigentlich gar keine Zeitleiste im Sinne einer Zeitachse.'' | |||
''Sonstiges:''<br> | |||
''- Die "Balken" für Private Kredite und öffentliche Schulden sind in Form und Gestaltung unterschiedlich.''<br> | |||
''- 3D Effekte erschweren die Lesbarkeit.''<br> | |||
''- Zusätzlich erschwerend ist, dass ein Teil der Balken nach oben und ein Teil nach unten zeigt, <br>obwohl kein Vegleich positiver mit negativer Werte dargestellt wird.''<br> | |||
''- Die vertikale Schrift ist schlecht lesbar und wäre wenn möglich zu vermeiden.''<br> | |||
''- unnötiges Beiwerk (Schiffs- oder Hafen-Metapher)''<br> | |||
''- schlechte Farbwahl (geringer Kontrast zu Hintergrund)''<br> | |||
''- Farbverläufe in den Balken erschweren Lesbarkeit''<br> | |||
== Redesign == | == Redesign == | ||
| Line 32: | Line 54: | ||
*For a better comparison we would need more data. There should be collected data from the same years or at least the same bench marks. It is not possible to compare apples and oranges. We create a solution for this problem. There for we calculate some more values (estimated values) to compare the same years and the same data. To get a better impression we have highlighted the original values with a brighter colour, because it would stand out more than a lighter or less saturated colour. | *For a better comparison we would need more data. There should be collected data from the same years or at least the same bench marks. It is not possible to compare apples and oranges. We create a solution for this problem. There for we calculate some more values (estimated values) to compare the same years and the same data. To get a better impression we have highlighted the original values with a brighter colour, because it would stand out more than a lighter or less saturated colour. | ||
''Ihr habt hier die fehlenden Balken durch lineare Interpolation eingefügt. Das sollte vermieden werden, <br>denn das geht schon in Richtung Datenmanipulation (vor allem, weil ihr auch noch exakte numerische Werte dazuschreibt. <br> | |||
''Es könnte nämlich auch sein, dass etwa die Schulden von einem Jahr auf das andere sprunghaft steigen <br>und das würde dann in Wahrheit ein völlig anderes Bild ergeben. <br> | |||
''Es sollte auch vermieden werden, Balken überlappend zu zeichnen (bis auf einen Ausnahmefall - vgl. S. Few), sondern nebeneinander.''<br> | |||
''Die Farbwahl wäre auch zu hinterfragen (das dunkle Rot ist gesättigter (scheint wichtiger zu sein) als das dunkle Blau).''<br> | |||
''Vertikale Schrift, auch für Quellenangabe, sollte - wenn möglich - vermieden werden.''<br> | |||
== Links == | == Links == | ||
Revision as of 18:18, 20 December 2007
Poor Graphic
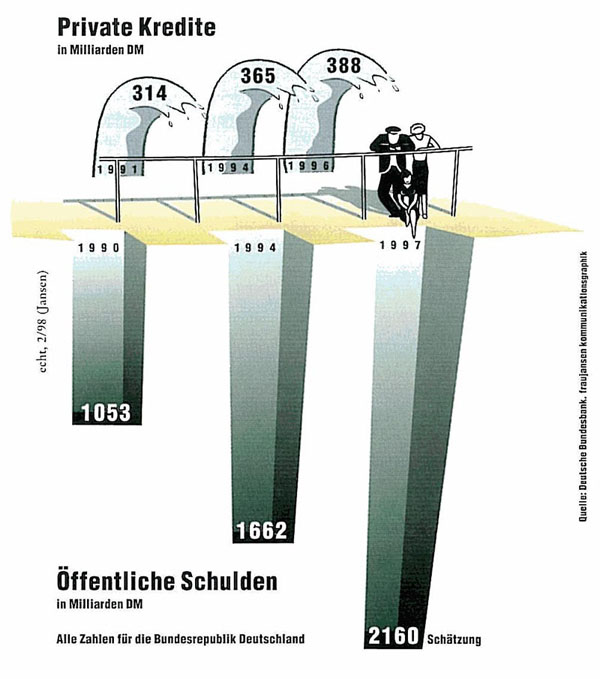
Private Kredite & öffentliche Schulden in der Bundesrepublik Deutschland
Critics
- It is the goal to maximize the data ink ratio and to reduce the non – data ink. In our example there is definitely too much non – data ink and even unnecessary data ink. For example the waves of credits, the balustrade, the people or the cores.
- Visual means to highlight data is split into two possibilities. You could visual data as greater or you could use contrasting visual data. But in our example the trying of highlight any data is failing.
Was meint ihr damit konkret? Präzisieren.
- The Label – what it is, when it is and who produced it, should stand in the title of the graphic. In our example there is something like a title but very small at the end of the graphic. Even more there is no explaining of the coherence between private credits and public debts.
Wenn ihr mit Titel "Private Kredite & öffentliche Schulden in der Bundesrepublik Deutschland" meint;
das ist meine Beschriftung der Abbildung im Wiki. Es gibt definitiv keinen Titel hier.
- The headlines and the explaining notes have a bad position. For example the note: “Schätzung”, is definitely on the wrong position. It gives you the impression that it is only guilty for this core.
Da der Zeitpunkt der Erhebung der Daten nicht angegeben ist (was der Fall sein sollte), kann nicht eindeutig gesagt werden,
ob Schätzung sich auf alle Balken, oder nur auf den 1997er bezieht. Ich würde aber auf Grund der Position auf letzteres tippen.
- It is hard to compare the data because of the values in different years. The timeline is not complete.
Es gibt eigentlich gar keine Zeitleiste im Sinne einer Zeitachse.
Sonstiges:
- Die "Balken" für Private Kredite und öffentliche Schulden sind in Form und Gestaltung unterschiedlich.
- 3D Effekte erschweren die Lesbarkeit.
- Zusätzlich erschwerend ist, dass ein Teil der Balken nach oben und ein Teil nach unten zeigt,
obwohl kein Vegleich positiver mit negativer Werte dargestellt wird.
- Die vertikale Schrift ist schlecht lesbar und wäre wenn möglich zu vermeiden.
- unnötiges Beiwerk (Schiffs- oder Hafen-Metapher)
- schlechte Farbwahl (geringer Kontrast zu Hintergrund)
- Farbverläufe in den Balken erschweren Lesbarkeit
Redesign
Declaration of improvements
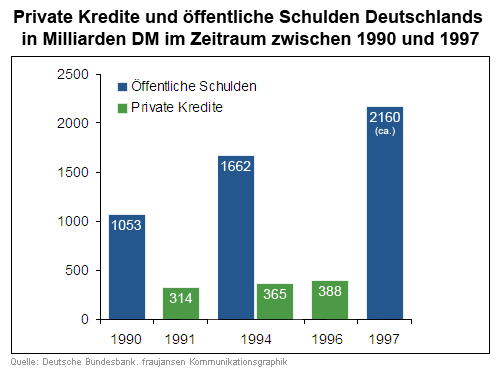
- A significant label with a short declaration, the period of data collection and from whom it is.
- The next step is to reduce the non – data ink, remove unnecessary data ink and emphasize the most important data ink. So we remove all the non – data ink like the balustrade and the people. To emphasize the most important data ink it will be necessary to replace the representations of the waves and the cores through simplicity like bars.
- We separate the two sections (credits and debts) with a colour separation. The spatial separation was not really clearly arranged. Further more we defined a declaration of the colours in the legend, to avoid the problem with the misplaced data.
- For a better comparison we would need more data. There should be collected data from the same years or at least the same bench marks. It is not possible to compare apples and oranges. We create a solution for this problem. There for we calculate some more values (estimated values) to compare the same years and the same data. To get a better impression we have highlighted the original values with a brighter colour, because it would stand out more than a lighter or less saturated colour.
Ihr habt hier die fehlenden Balken durch lineare Interpolation eingefügt. Das sollte vermieden werden,
denn das geht schon in Richtung Datenmanipulation (vor allem, weil ihr auch noch exakte numerische Werte dazuschreibt.
Es könnte nämlich auch sein, dass etwa die Schulden von einem Jahr auf das andere sprunghaft steigen
und das würde dann in Wahrheit ein völlig anderes Bild ergeben.
Es sollte auch vermieden werden, Balken überlappend zu zeichnen (bis auf einen Ausnahmefall - vgl. S. Few), sondern nebeneinander.
Die Farbwahl wäre auch zu hinterfragen (das dunkle Rot ist gesättigter (scheint wichtiger zu sein) als das dunkle Blau).
Vertikale Schrift, auch für Quellenangabe, sollte - wenn möglich - vermieden werden.

