Teaching:TUW - UE InfoVis WS 2007/08 - Gruppe 01 - Aufgabe 4
Aufgabenstellung
Aufgabe ist das Design einer interaktiven Visualisierungsapplikation zur Darstellung und Exploration
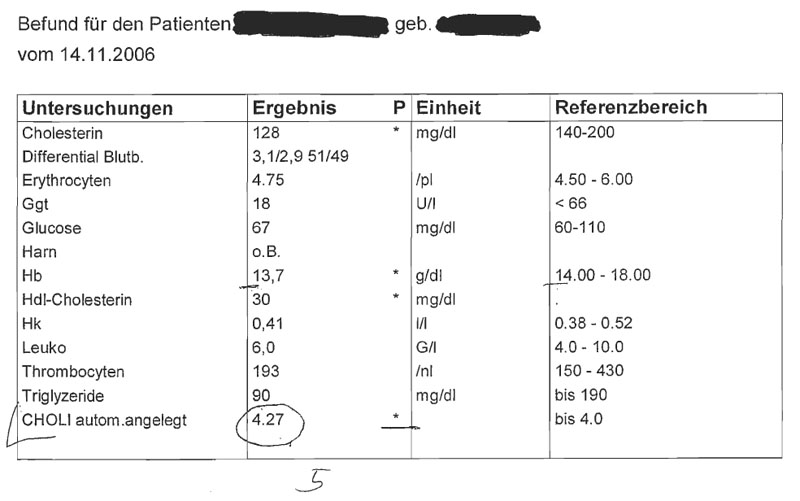
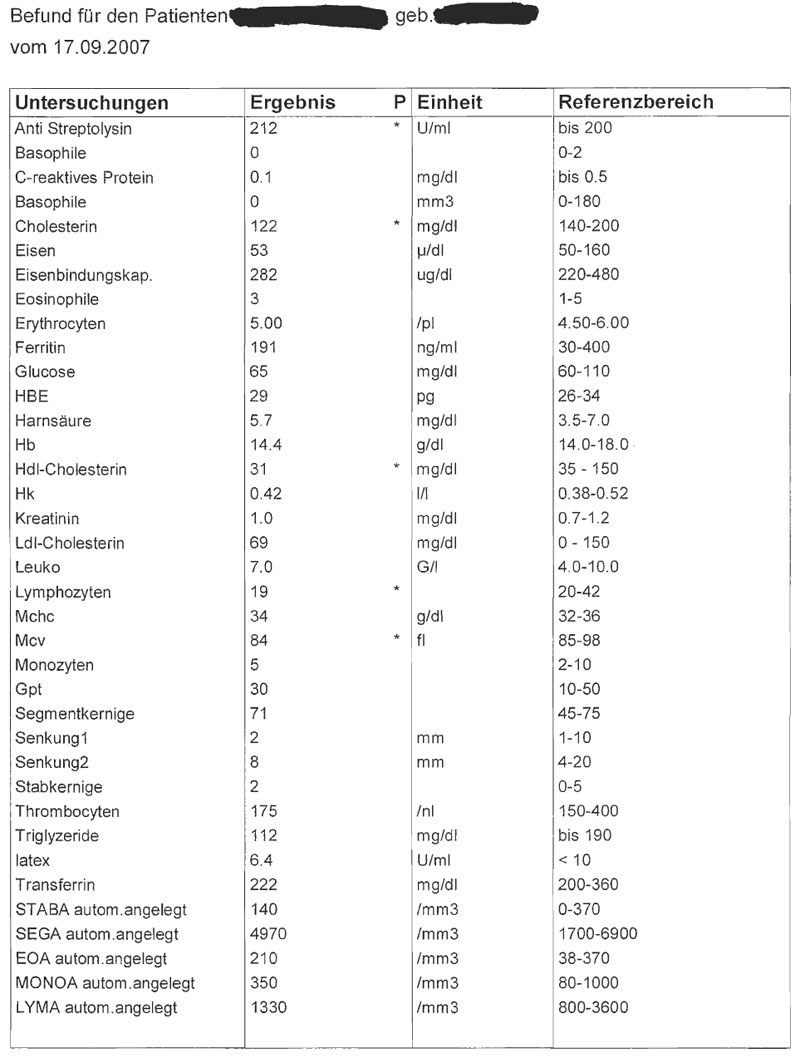
(des zeitlichen Verlaufs) von Laborwerten einer Blutuntersuchung. BenutzerInnen, Einsatzzweck, Tasks, etc.
sollen von Euch selbst festgelegt und beschrieben werden.
Beispiele für derartige Datensätze
Description of application area, data, users, tasks and objectives
Description of application area and the given dataset
- Blood examination
- Different valuations
- Wide range of values
- Different units
- Inconsistent dataset (not every test holds all values)
- Same values always present
- Multidimensional data
- The bulk of the data has a individual reference range

