File list
Jump to navigation
Jump to search
This special page shows all uploaded files.
| Date | Name | Thumbnail | Size | User | Description | Versions |
|---|---|---|---|---|---|---|
| 20:48, 10 April 2006 | Plaisant.jpg (file) |  |
5 KB | UE-InfoVis06-11 (talk | contribs) | This is Catherine Plaisant. | 1 |
| 20:41, 10 April 2006 | Bederson.jpg (file) |  |
17 KB | UE-InfoVis06-11 (talk | contribs) | This is Ben Bederson | 1 |
| 20:39, 10 April 2006 | Apperley.jpg (file) |  |
6 KB | UE-InfoVis06-11 (talk | contribs) | This is Mark Apperley | 1 |
| 14:53, 10 April 2006 | Rao.jpg (file) |  |
12 KB | Gruppe11 (talk | contribs) | 1 | |
| 09:42, 10 April 2006 | Pirolli.jpg (file) |  |
22 KB | Gruppe11 (talk | contribs) | This is Peter Pirolli. | 1 |
| 12:57, 9 April 2006 | Ahlberg.jpg (file) |  |
6 KB | UE-InfoVis06-10 (talk | contribs) | 1 | |
| 10:49, 5 April 2006 | Bernhard Fölsner.jpg (file) |  |
4 KB | UE-InfoVis06-15 (talk | contribs) | Category: Persons BERNHARD FÖLSNER | 1 |
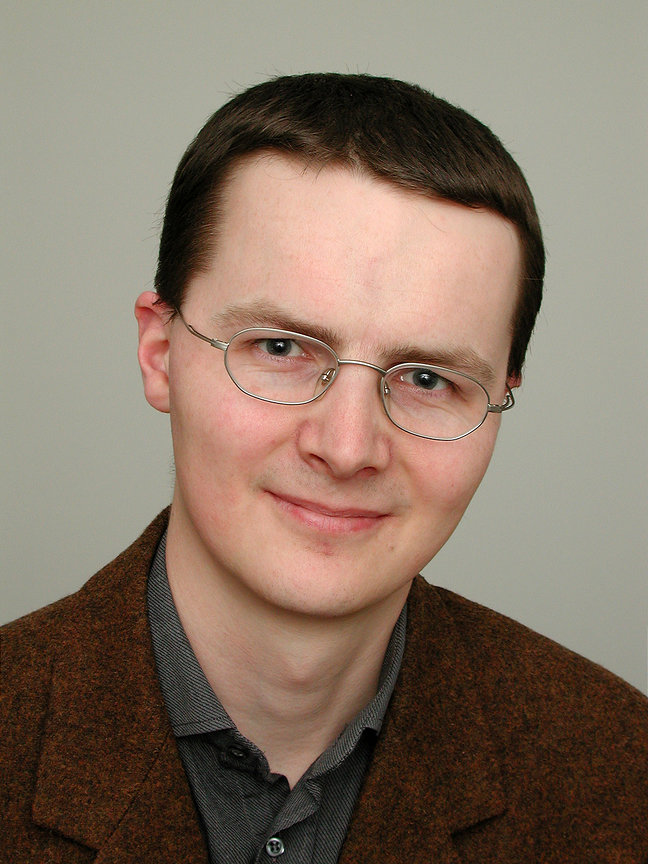
| 08:36, 4 April 2006 | 2001-03-20-HH-photo-0648x0864.jpg (file) |  |
136 KB | Hauser@VRVis.at (talk | contribs) | Helwig Hauser, 2001 | 1 |
| 09:05, 27 March 2006 | EduardGroeller.jpg (file) |  |
107 KB | Werner Purgathofer (talk | contribs) | Eduard Groeller happily discussing on 22nd November, 2005. | 1 |
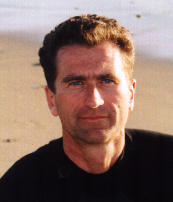
| 09:04, 27 March 2006 | HelwigHauser.jpg (file) |  |
106 KB | Werner Purgathofer (talk | contribs) | Helwig Hauser during a dinner in Vienna on 23rd March, 2006. | 1 |
| 09:01, 27 March 2006 | SilviaMiksch.jpg (file) |  |
144 KB | Werner Purgathofer (talk | contribs) | Silvia Miksch during a dinner in Vienna on 23rd March, 2006. | 1 |
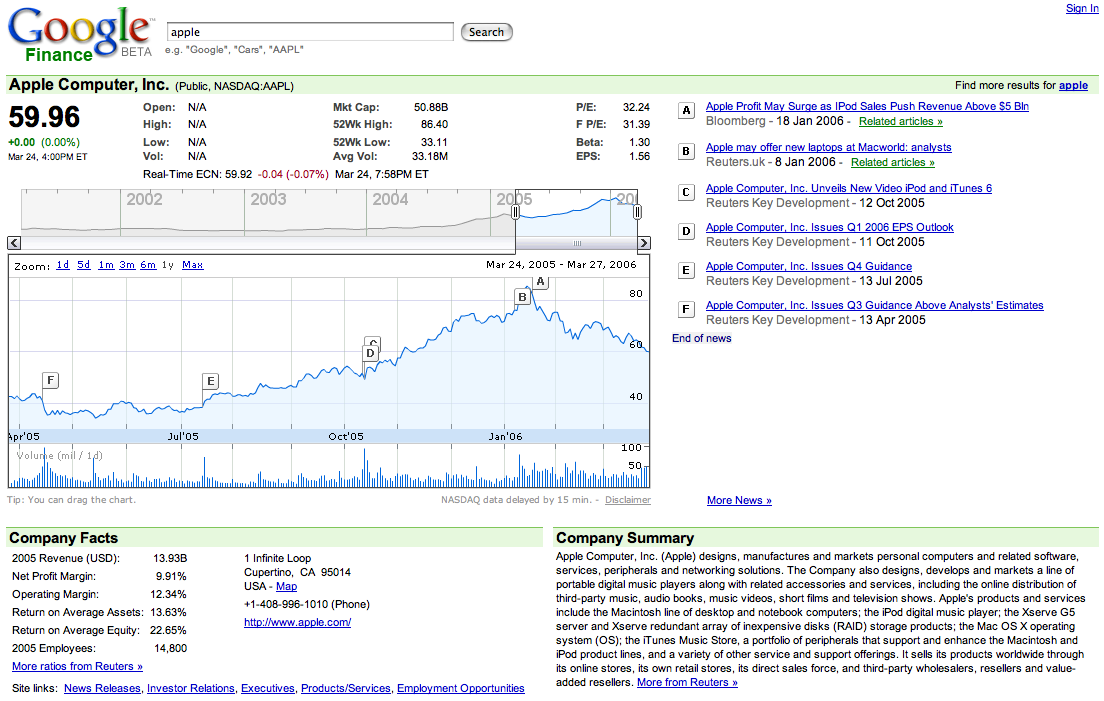
| 08:53, 27 March 2006 | Google06finance.png (file) |  |
170 KB | Iwolf (talk | contribs) | Interactive Flash graphs to explore stock price data from Google Finance. | 1 |
| 08:49, 27 March 2006 | DSC01027.jpg (file) |  |
107 KB | Werner Purgathofer (talk | contribs) | This image shows Prof. Eduard Groeller from Vienna University of Technology happily discussing during an event. Inage was taken on 22nd November, 2005. | 1 |
| 07:41, 27 March 2006 | Smartmoney06marketradar.gif (file) |  |
109 KB | Iwolf (talk | contribs) | Interactive data visualization of historical stock prices | 1 |
| 17:26, 15 February 2006 | Gravi-- logo2.gif (file) | 38 KB | Klaus (talk | contribs) | Logo of Gravi++: an interactive Information Visualization | 1 | |
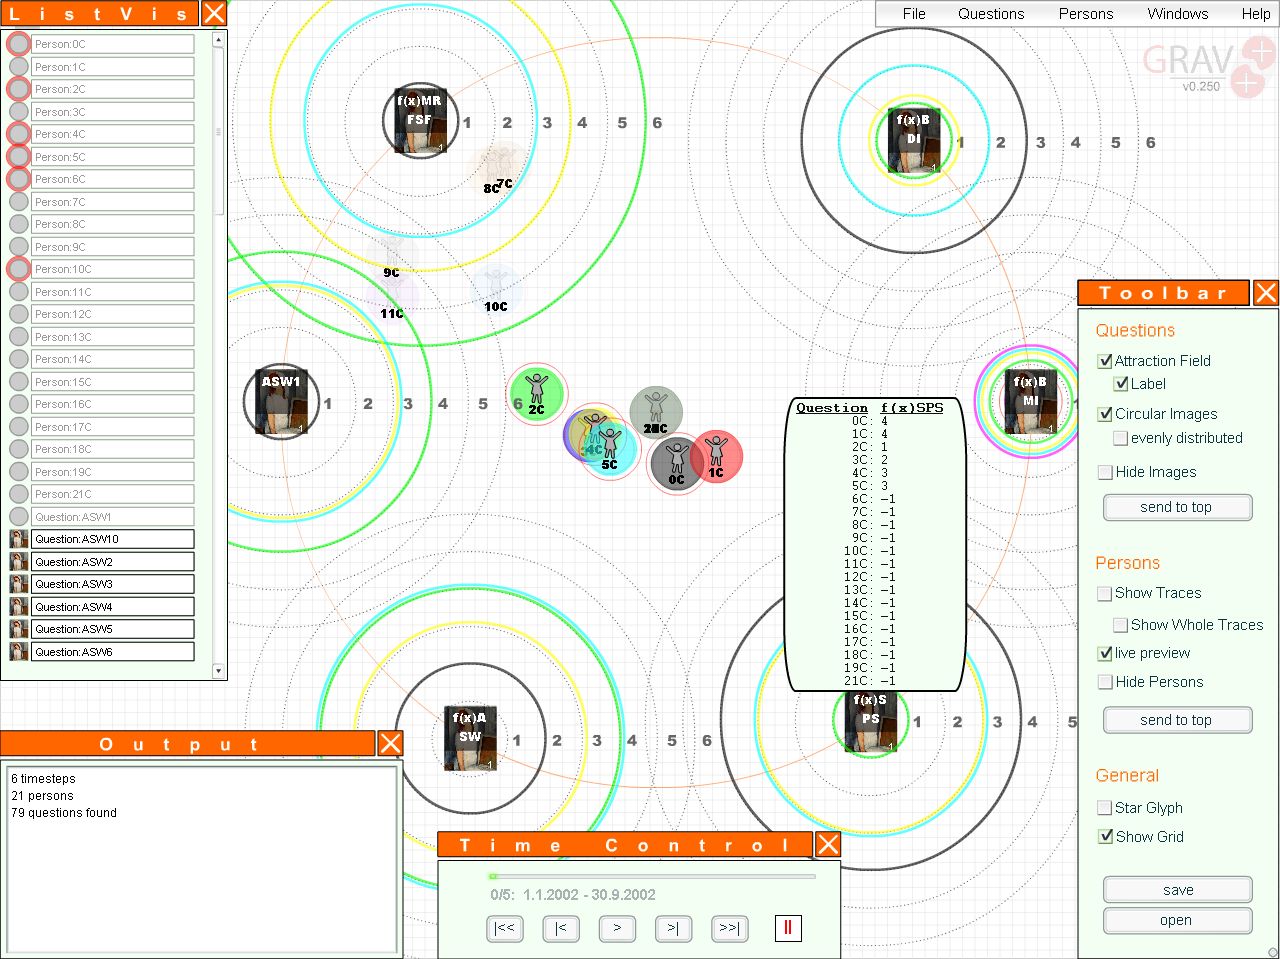
| 17:03, 15 February 2006 | Gravi Screenshot.jpg (file) |  |
237 KB | Klaus (talk | contribs) | Screenshot of Gravi++ | 1 |
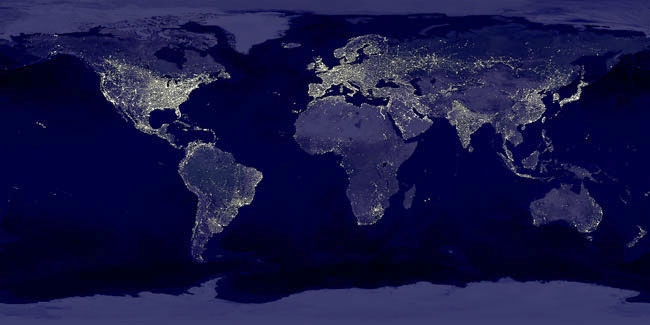
| 12:31, 1 February 2006 | Earthlights dmsp.jpg (file) |  |
33 KB | UE-InfoVis0506 9335259 (talk | contribs) | Figure 3: 'Realmural' nach: http://antwrp.gsfc.nasa.gov/apod/ap001127.html [NASA, 2000] | 1 |
| 12:29, 1 February 2006 | Sunspot mo.gif (file) |  |
8 KB | UE-InfoVis0506 9335259 (talk | contribs) | Figure 1: Plot of average number of sun spots recorded per month, 1850-1993. [Jerding et al., 1996] | 1 |
| 12:27, 1 February 2006 | Sunspot.gif (file) |  |
11 KB | UE-InfoVis0506 9335259 (talk | contribs) | Figure 2: Mural of the number of sun spots recorded daily, 1850-1993. [Jerding et al., 1996] | 1 |
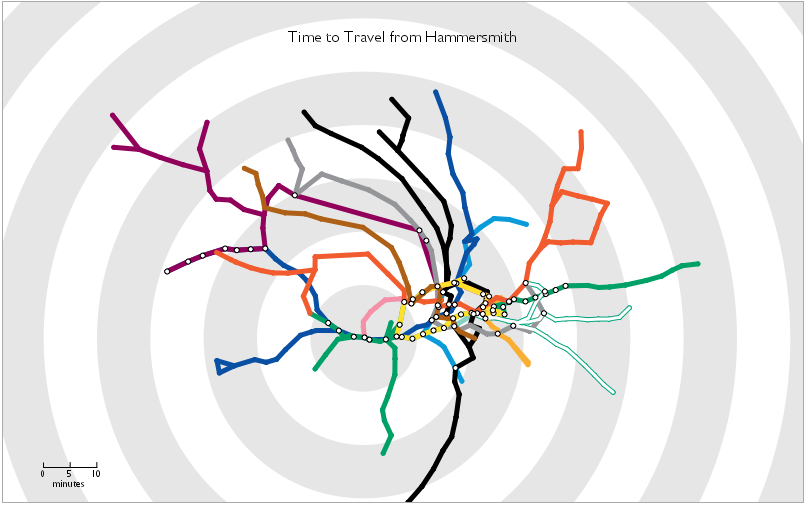
| 15:51, 25 January 2006 | Carden06travel time tube map.png (file) |  |
97 KB | Iwolf (talk | contribs) | Travel Time Tube Map - Screenshot of an [http://www.processing.org processing] Applet that distorts the London underground network circularly according to travel times from a selected station. | 1 |
| 15:50, 11 January 2006 | Information visualization journal palgrave.jpg (file) |  |
7 KB | Klaus (talk | contribs) | Book cover of the Information Visualization Journal from Palgrave Macmillan. Taken from http://www.palgrave-journals.com/ivs/index.html. | 1 |
| 14:46, 8 January 2006 | InfoVis Gruppe10 Aufgabe3 Prototype2.jpg (file) |  |
127 KB | UE-InfoVis0506 0027476 (talk | contribs) | Screenshot of prototype v2 | 1 |
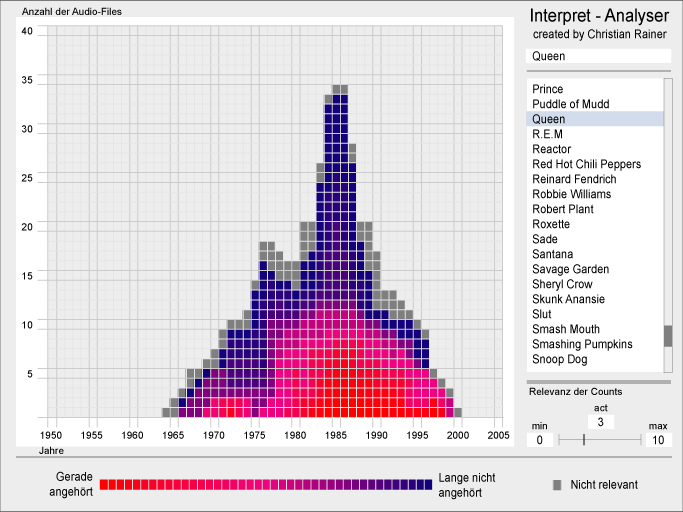
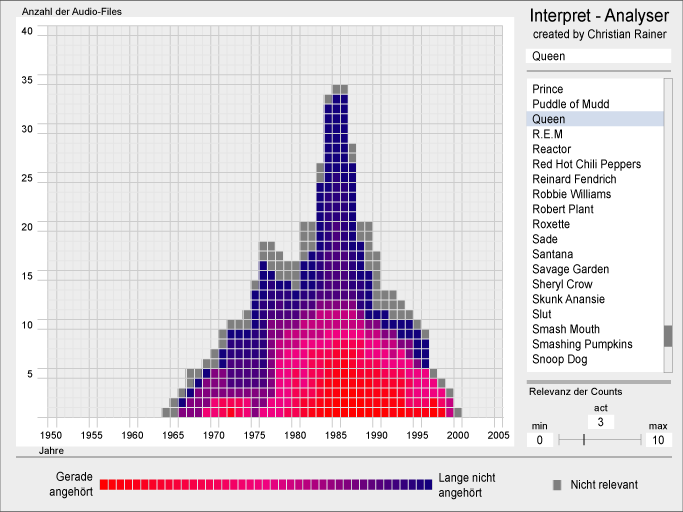
| 22:55, 20 December 2005 | G4 Interpret-Analyser.jpg (file) |  |
207 KB | UE-InfoVis0506 0026629 (talk | contribs) | Screenshot of the Prototype | 1 |
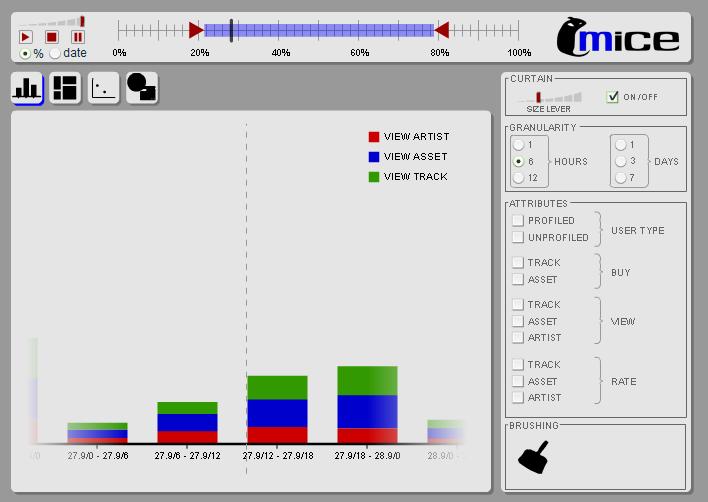
| 18:00, 20 December 2005 | Screenshot 2.jpg (file) |  |
40 KB | UE-InfoVis0506 0306110 (talk | contribs) | Screenshot of MICE Tool. | 1 |
| 17:55, 20 December 2005 | Screenshot 2.JPG (file) |  |
40 KB | UE-InfoVis0506 0306110 (talk | contribs) | Screenshot of MICE Tool with Barchart in the picture. | 1 |
| 11:44, 9 December 2005 | Bookcover post datavisualization star.jpg (file) |  |
110 KB | Klaus (talk | contribs) | Book cover of Post F. H. and Nielson G. M. and Bonneau G.: Data Visualization - The State of the Art, Kluwer, 2003. Retreived from Amazon.com at 09. Dezember 2005 | 1 |
| 20:46, 8 December 2005 | Interpret-Analyser.png (file) |  |
78 KB | UE-InfoVis0506 0026754 (talk | contribs) | Prototype of the Interpret-Analyser | 1 |
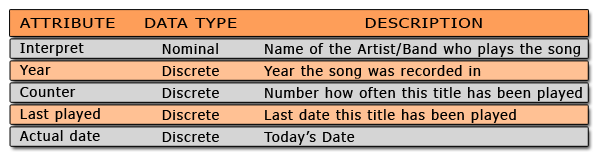
| 21:29, 2 December 2005 | Tabelle datentyp g4.png (file) | 14 KB | UE-InfoVis0506 0026629 (talk | contribs) | Table of data types used in the prototype | 1 | |
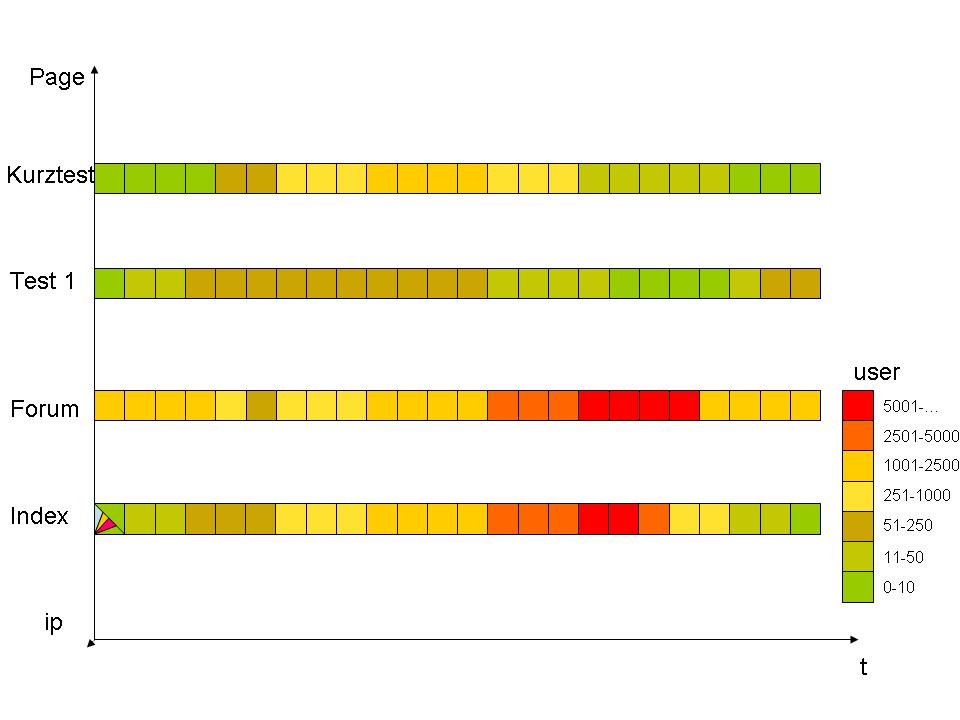
| 11:51, 2 December 2005 | Folie11.JPG (file) |  |
72 KB | UE-InfoVis0506 9825503 (talk | contribs) | 3 | |
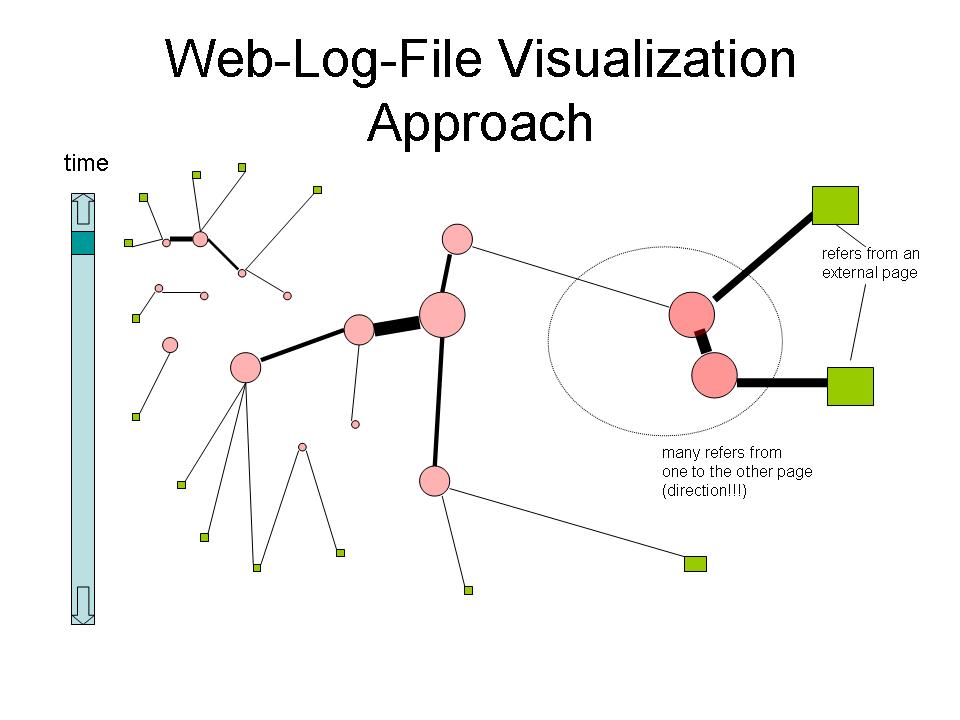
| 11:50, 2 December 2005 | Folie11.jpg (file) |  |
72 KB | UE-InfoVis0506 9825503 (talk | contribs) | 1 | |
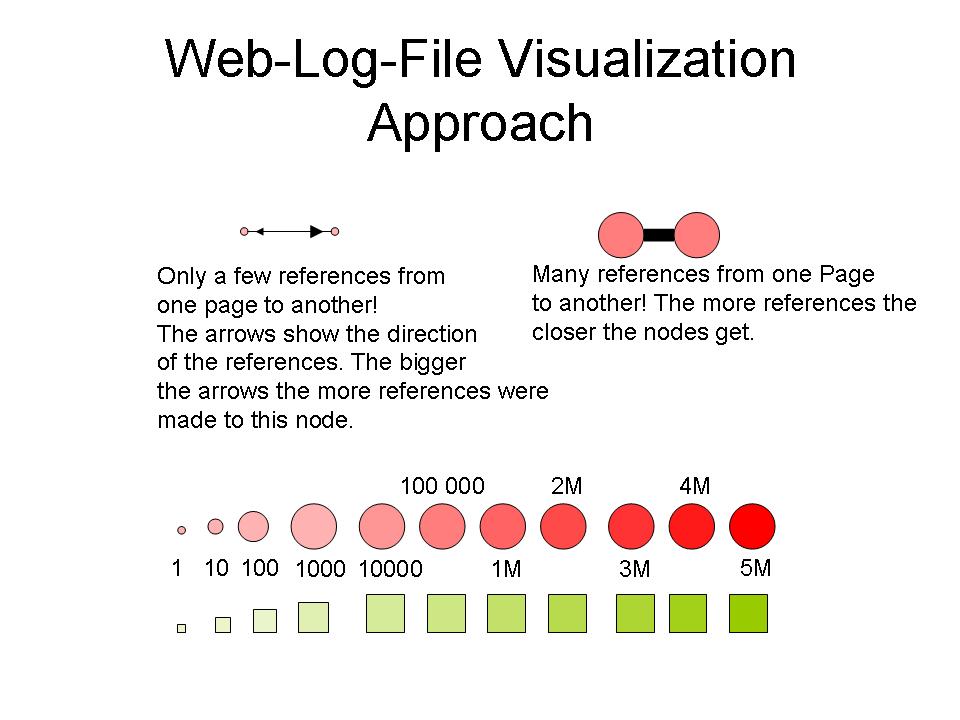
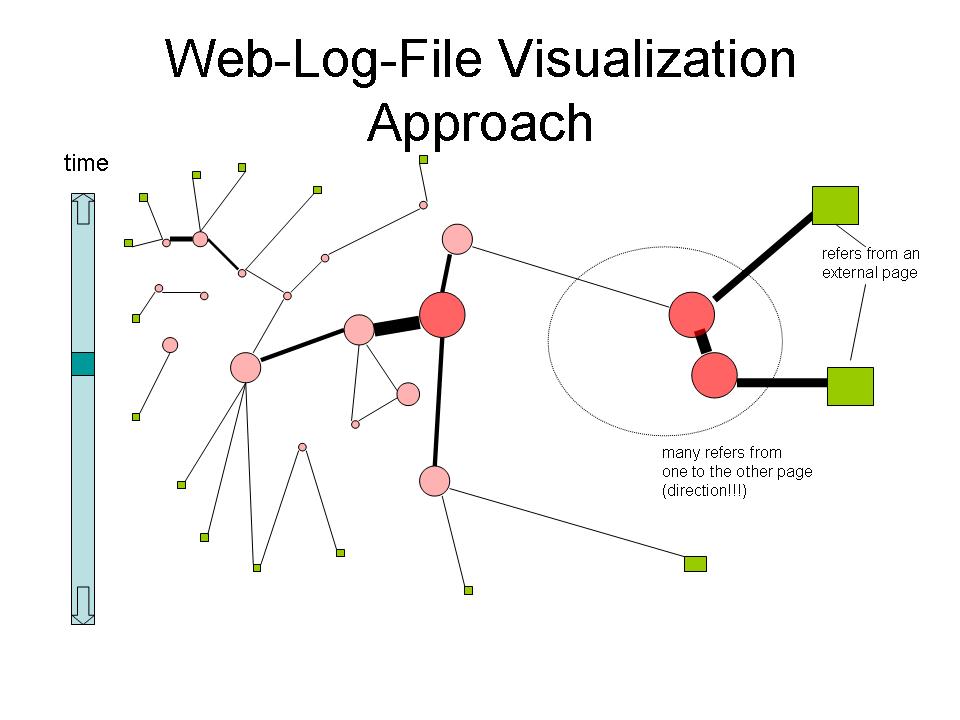
| 11:47, 2 December 2005 | LogVisulisierungsEntwurf.jpg (file) |  |
72 KB | UE-InfoVis0506 9825503 (talk | contribs) | 1 | |
| 11:40, 2 December 2005 | Folie10.JPG (file) |  |
54 KB | UE-InfoVis0506 9825503 (talk | contribs) | 1 | |
| 11:39, 2 December 2005 | Folie9.JPG (file) |  |
54 KB | UE-InfoVis0506 9825503 (talk | contribs) | 1 | |
| 11:37, 2 December 2005 | Folie8.JPG (file) |  |
52 KB | UE-InfoVis0506 9825503 (talk | contribs) | 1 | |
| 11:35, 2 December 2005 | Folie4.JPG (file) |  |
49 KB | UE-InfoVis0506 9825503 (talk | contribs) | 1 | |
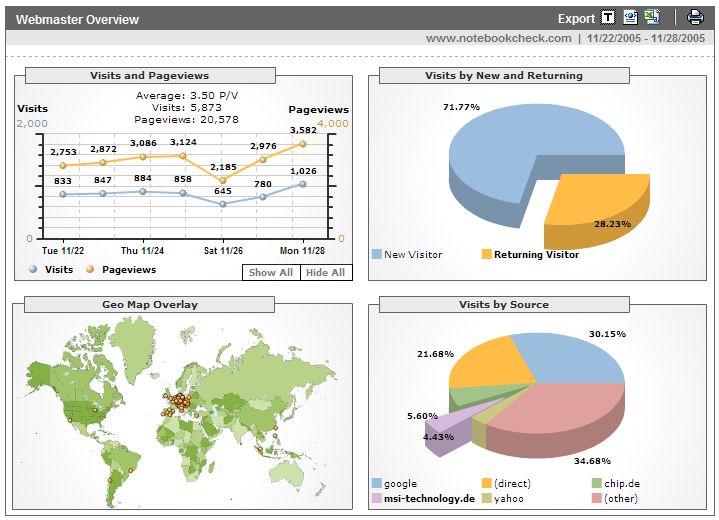
| 14:41, 29 November 2005 | Analytics wiki.jpg (file) |  |
63 KB | Klaus (talk | contribs) | Screenshot of Google Analytics http://www.google.com/analytics/ visualizing data from http://www.notebookcheck.com/ | 1 |
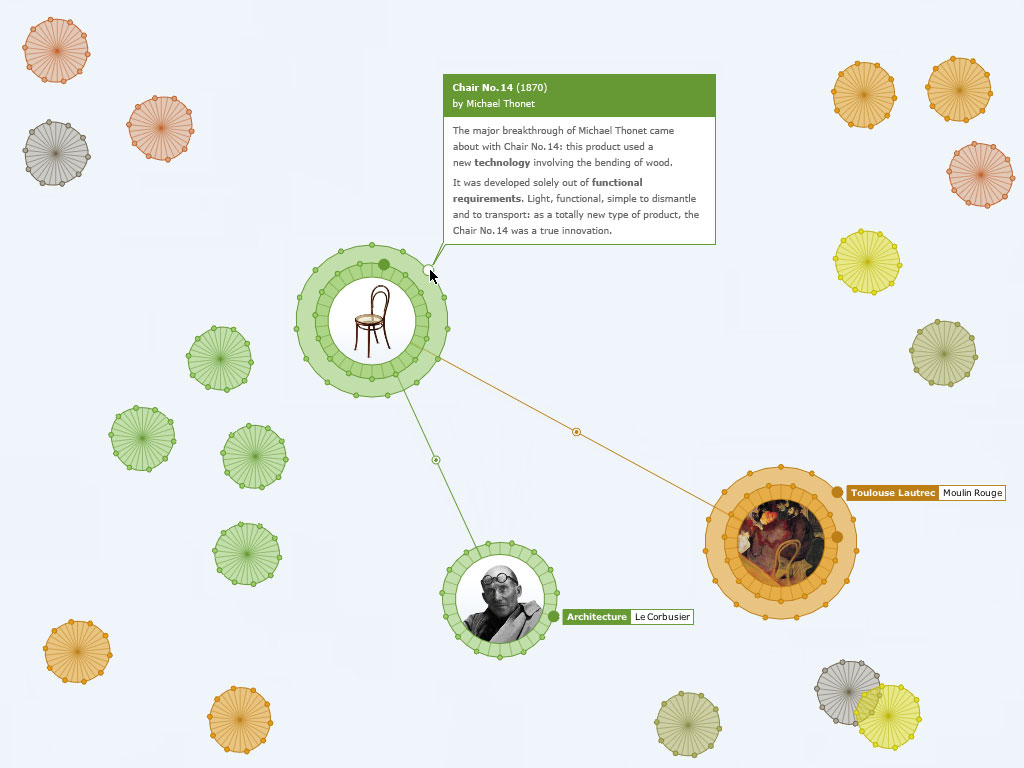
| 13:05, 29 November 2005 | Horn05jellyfish.jpg (file) |  |
92 KB | Iwolf (talk | contribs) | Jellyfish visualizes an encyclopedia of the arts. The application is developed in Processing and uses an XML-database to update content. | 1 |
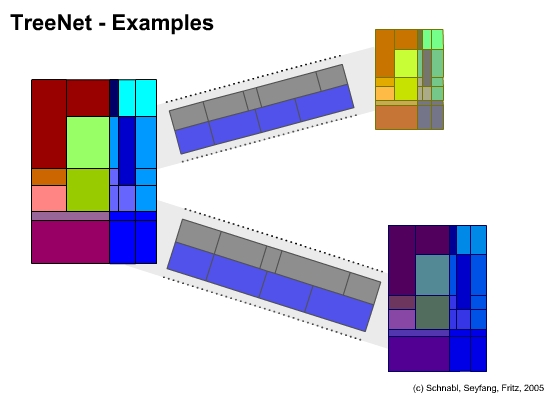
| 19:01, 26 November 2005 | TreeNetFull.jpg (file) |  |
62 KB | UE-InfoVis0506 0306110 (talk | contribs) | Example for a possible TreeNet. | 1 |
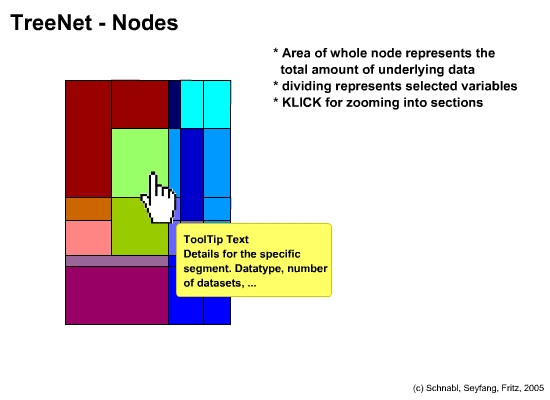
| 19:00, 26 November 2005 | TreeNetSchema.jpg (file) |  |
58 KB | UE-InfoVis0506 0306110 (talk | contribs) | Schema of the TreeNet technique for database structured data. | 1 |
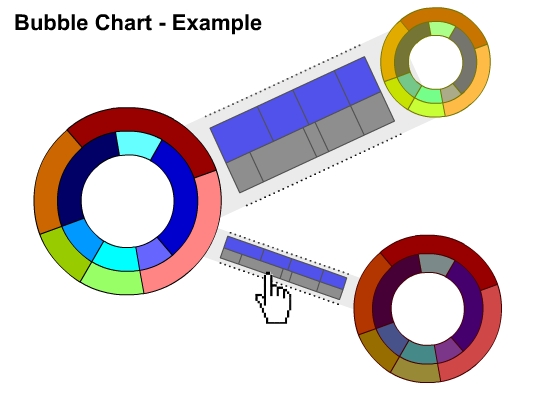
| 18:49, 26 November 2005 | BubbleSchemaFull.jpg (file) |  |
87 KB | UE-InfoVis0506 0306110 (talk | contribs) | Full example of the Bubble Chart technique. | 1 |
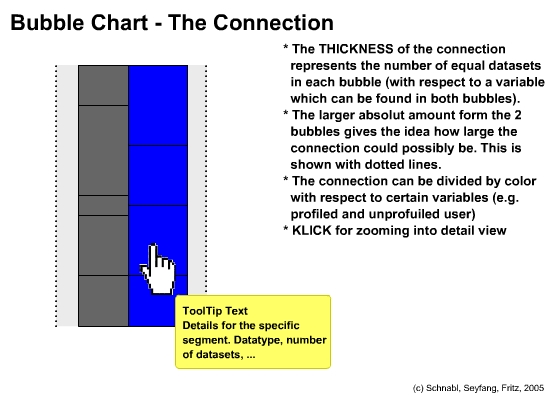
| 18:43, 26 November 2005 | BubbleConnSchema.jpg (file) |  |
101 KB | UE-InfoVis0506 0306110 (talk | contribs) | Schema of the connection parts of the Bubble Chart technique. | 1 |
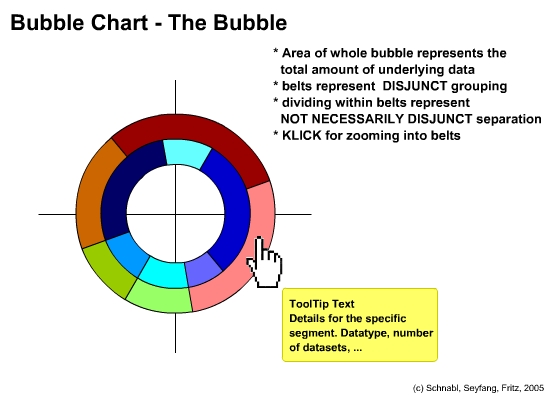
| 18:42, 26 November 2005 | BubbleSchema.jpg (file) |  |
86 KB | UE-InfoVis0506 0306110 (talk | contribs) | Schema of the Bubble Chart technique for visualizing datastructures modelled with ER diagramms. | 1 |
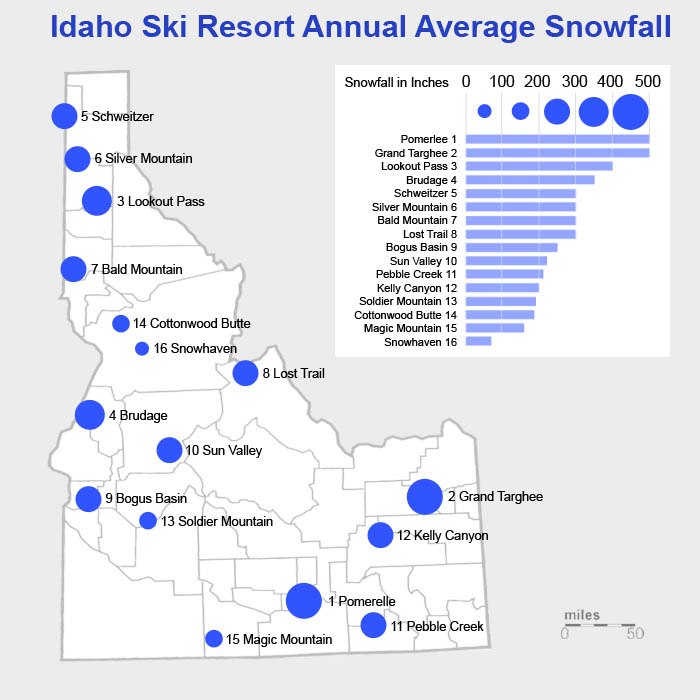
| 22:50, 25 November 2005 | SnowfallIdaho9.jpg (file) |  |
108 KB | UE-InfoVis0506 0306110 (talk | contribs) | Snowfall values in Idaho, annual average. | 4 |
| 09:46, 25 November 2005 | Tufte-bar chart-redesign.gif (file) |  |
95 KB | Iwolf (talk | contribs) | E. Tufte's bar chart redesign | 1 |
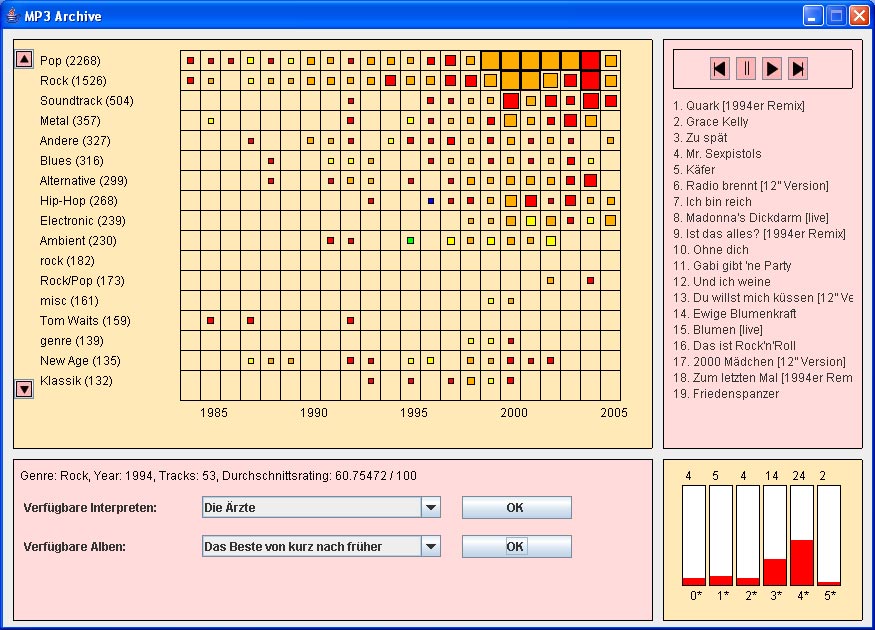
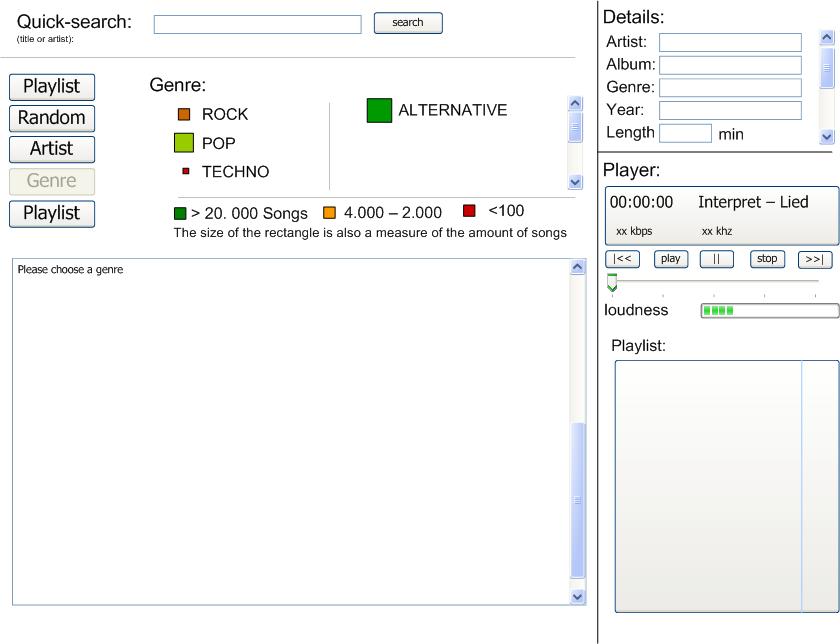
| 01:39, 23 November 2005 | MP3 Viewer.gif (file) |  |
49 KB | UE-InfoVis0506 0026754 (talk | contribs) | Preview for MP3_Viewer prototype | 5 |
| 22:34, 22 November 2005 | Screenshot.jpg (file) |  |
50 KB | UE-InfoVis0506 0402143 (talk | contribs) | 1 | |
| 22:32, 22 November 2005 | Screenshot(2).jpg (file) | .jpg) |
50 KB | UE-InfoVis0506 0402143 (talk | contribs) | 1 | |
| 22:31, 22 November 2005 | Mp3.jpg (file) |  |
50 KB | UE-InfoVis0506 0225264 (talk | contribs) | Screenshot | 2 |
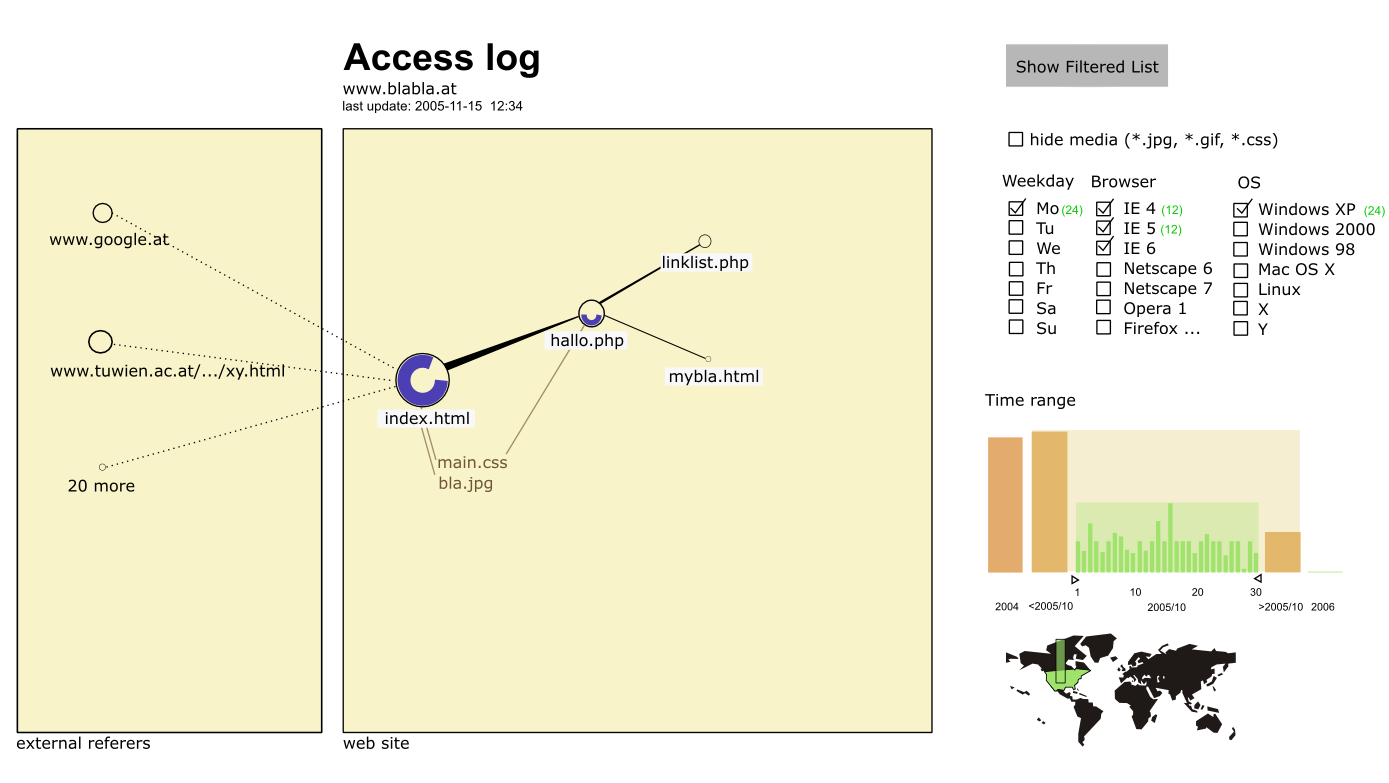
| 18:33, 22 November 2005 | Infovis weblog fake.png (file) |  |
126 KB | UE-InfoVis0506 9426777 (talk | contribs) | 3 | |
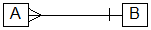
| 17:54, 22 November 2005 | MiceRelation.png (file) | 718 bytes | UE-InfoVis0506 0325693 (talk | contribs) | Simple flowchart explaining the description of a 1:n relation. | 1 |