File list
Jump to navigation
Jump to search
This special page shows all uploaded files.
| Date | Name | Thumbnail | Size | User | Description | Versions |
|---|---|---|---|---|---|---|
| 13:30, 2 July 2018 | 9781466508910.jpg (file) |  |
43 KB | AArleo PhD (talk | contribs) | 1 | |
| 13:14, 25 June 2018 | 9781482257373.jpg (file) |  |
35 KB | AArleo PhD (talk | contribs) | 1 | |
| 09:52, 25 June 2018 | VisOfTimeOrientedDataCover.jpeg (file) |  |
42 KB | AArleo PhD (talk | contribs) | 1 | |
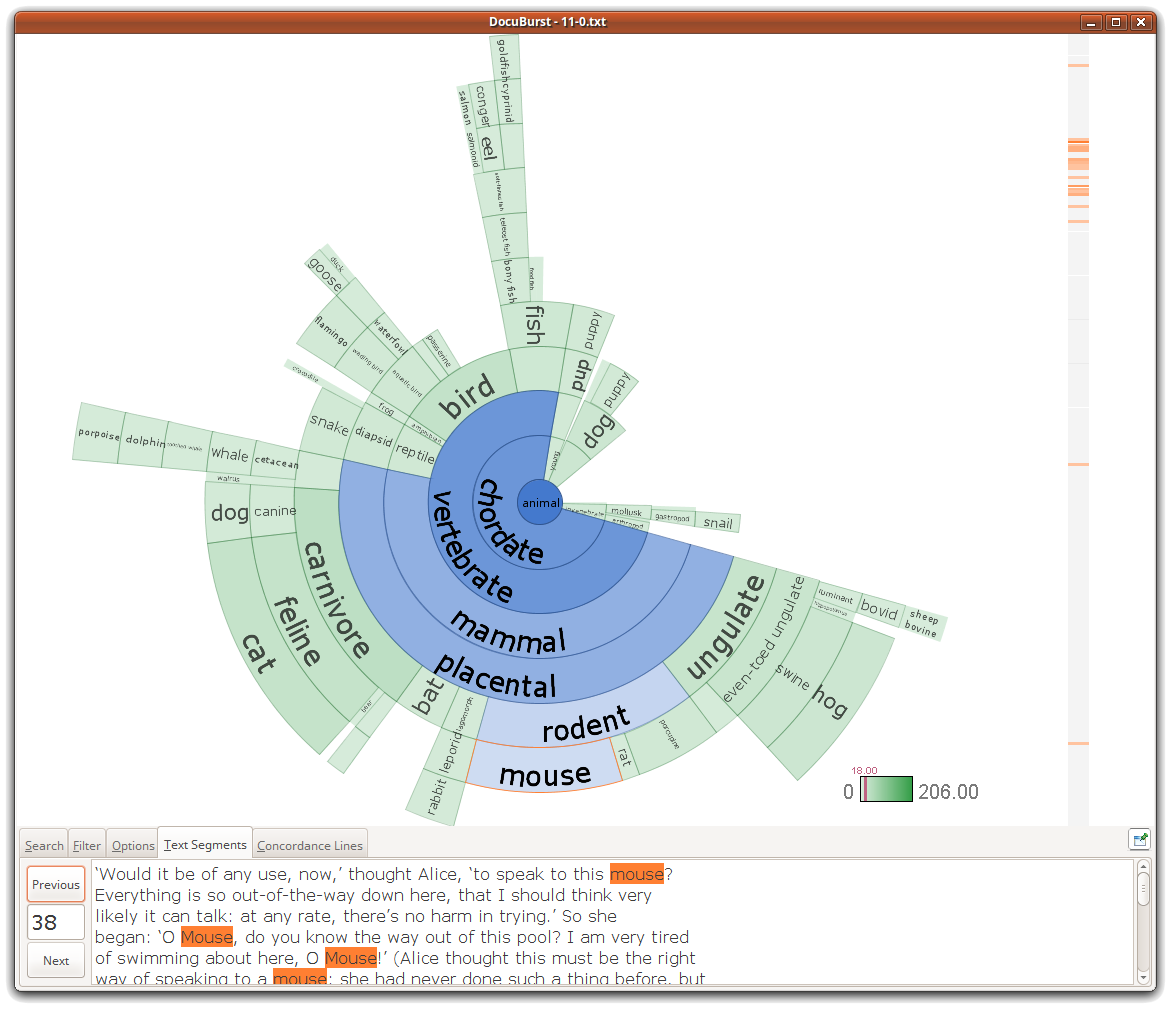
| 08:37, 21 February 2018 | Docuburst-alice-animal-ui.png (file) |  |
220 KB | Arind (talk | contribs) | DocuBurst software created by Christopher Collins currently maintained by Rafael Veras showing "Alice’s Adventures in Wonderland", by Lewis Carroll | 1 |
| 13:17, 11 January 2018 | Tgschwandtner.jpg (file) |  |
74 KB | Theresia Gschwandtner (talk | contribs) | 1 | |
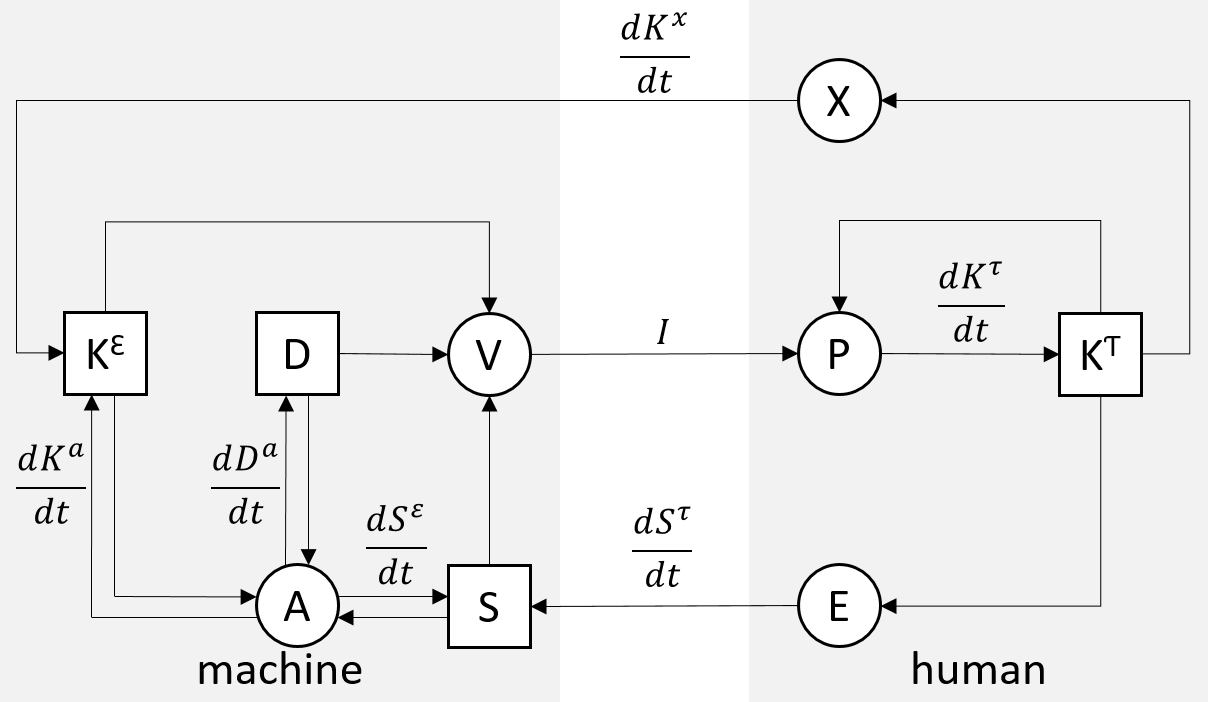
| 10:54, 2 August 2017 | KnAVA Model.png (file) |  |
42 KB | Arind (talk | contribs) | Conceptual Model of Knowledge-Assisted Visual Analytics. The model is divided into two spaces (machine and human) and describes knowledge generation, conversion, and exploitation within the visual analytics discourse, in terms of processes: analysis A... | 1 |
| 13:08, 24 March 2017 | MalwareVisualizationTaxonomy with References.pdf (file) | 731 KB | Arind (talk | contribs) | Categorization of malware visualization systems into three categories, namely (1) Individual Malware Analysis, (2) Malware Comparison, and (3) Malware Summarization. All systems have the ultimate goal to generate rules and signatures for fully-automate... | 1 | |
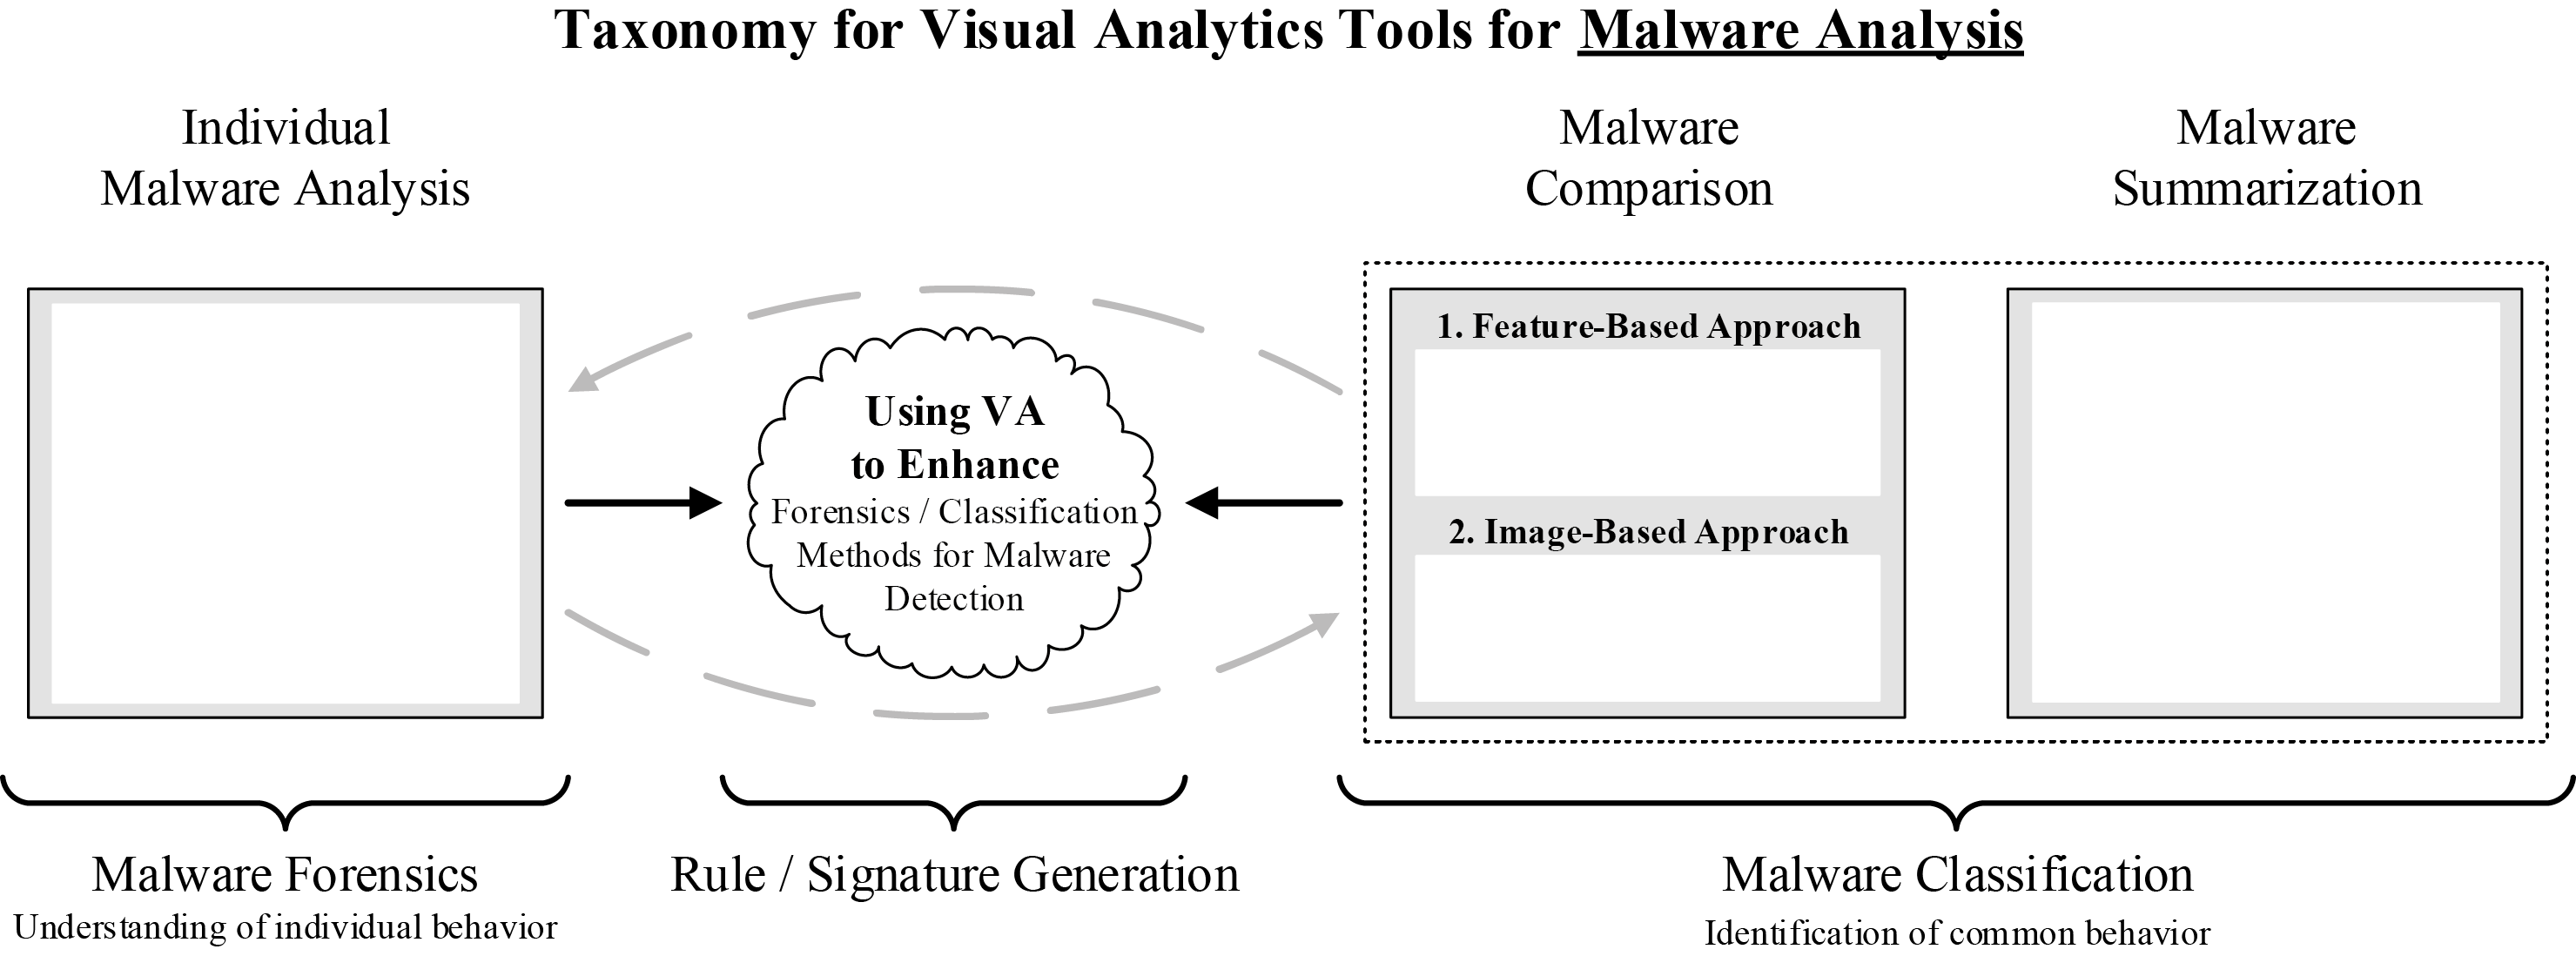
| 13:07, 24 March 2017 | MalwareVisualizationTaxonomy without Text.png (file) |  |
121 KB | Arind (talk | contribs) | Categorization of malware visualization systems into three categories, namely (1) Individual Malware Analysis, (2) Malware Comparison, and (3) Malware Summarization. All systems have the ultimate goal to generate rules and signatures for fully-automate... | 1 |
| 13:06, 24 March 2017 | MalwareVisualizationTaxonomy without Text.pdf (file) | 720 KB | Arind (talk | contribs) | Categorization of malware visualization systems into three categories, namely (1) Individual Malware Analysis, (2) Malware Comparison, and (3) Malware Summarization. All systems have the ultimate goal to generate rules and signatures for fully-automate... | 1 | |
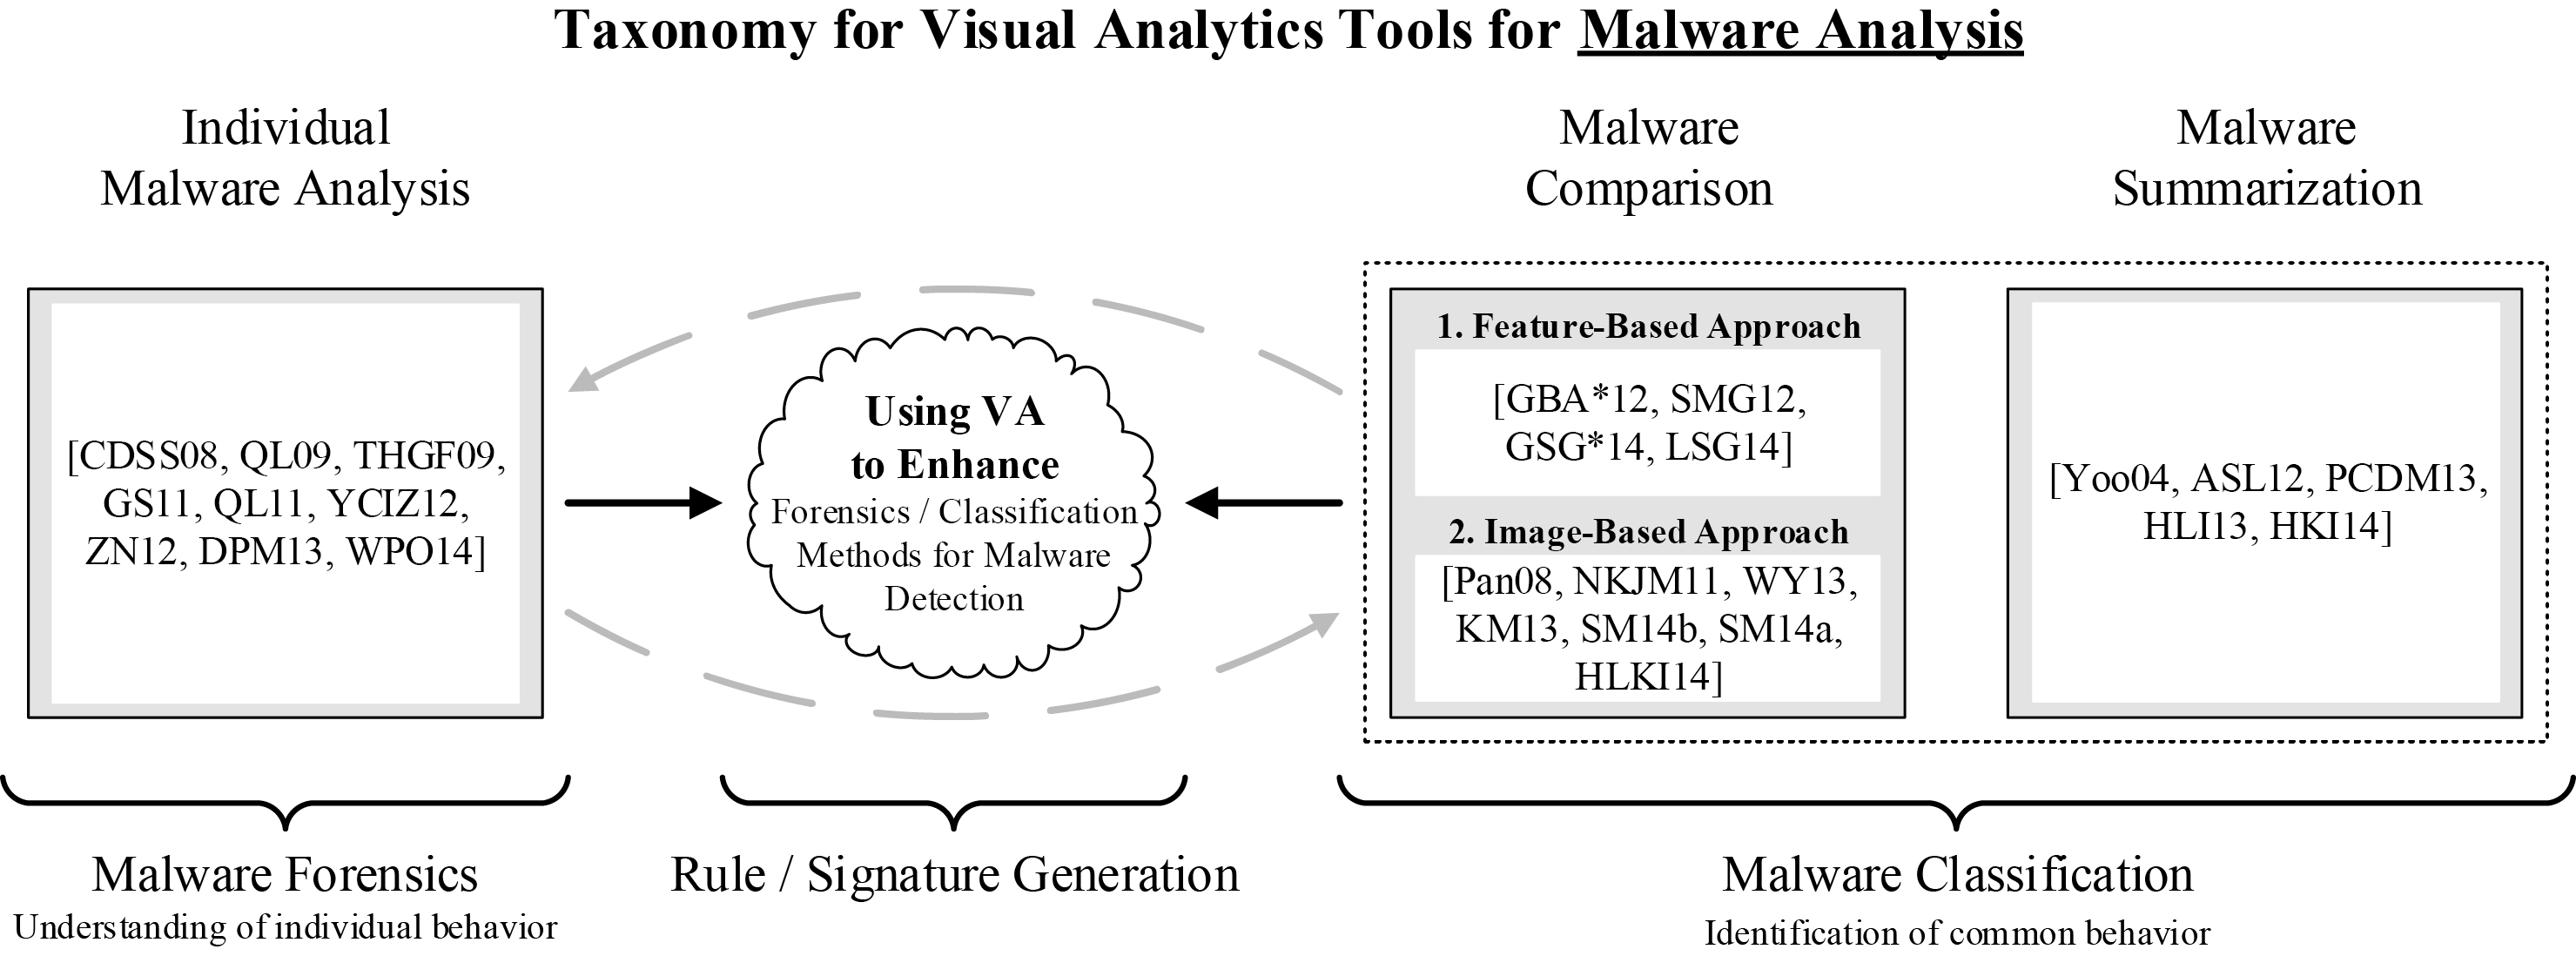
| 12:44, 24 March 2017 | Malware VisualizationTaxonomy with References.png (file) |  |
165 KB | Arind (talk | contribs) | Categorization of malware visualization systems into three categories, namely (1) Individual Malware Analysis, (2) Malware Comparison, and (3) Malware Summarization. All systems have the ultimate goal to generate rules and signatures for fully-automate... | 1 |
| 21:58, 21 February 2016 | Pparsons.jpg (file) |  |
252 KB | Paulparsons (talk | contribs) | 2 | |
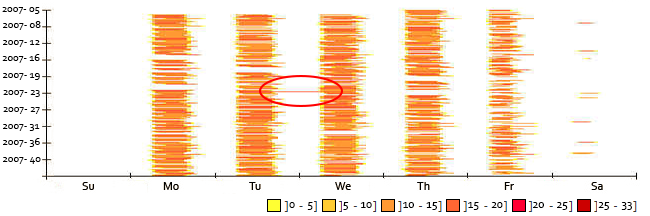
| 15:36, 12 November 2015 | TimeCleanserHeatmap.png (file) |  |
99 KB | Theresia Gschwandtner (talk | contribs) | TimeCleanser - A Visual Analytics Approach for Data Cleansing of Time-Oriented Data | 1 |
| 08:43, 12 November 2015 | Gnaeus.pdf (file) | 170 KB | Paolofdr (talk | contribs) | Gnaeus: a guideline-based knowledge-assisted EHR visualization for cohorts. | 1 | |
| 08:14, 24 June 2015 | PaoloFederico.jpg (file) |  |
34 KB | Paolofdr (talk | contribs) | 1 | |
| 13:28, 16 April 2014 | LNCS8380-small.png (file) |  |
56 KB | Kerren (talk | contribs) | 1 | |
| 11:08, 24 October 2013 | RainerPlaninc.jpg (file) |  |
11 KB | UE-InfoVis0607 0425163 (talk | contribs) | Reverted to version as of 11:07, 24 October 2013 | 4 |
| 09:08, 13 February 2013 | DI Dr Markus Rester 140x185 bw.jpg (file) |  |
10 KB | Markus (talk | contribs) | 1 | |
| 09:47, 3 August 2012 | Igw hci mini.png (file) |  |
3 KB | Markus (talk | contribs) | 1 | |
| 09:40, 3 August 2012 | Logo EC JRC.jpg (file) |  |
25 KB | Markus (talk | contribs) | 1 | |
| 07:12, 19 July 2012 | Spybubble android 1800.jpg (file) |  |
8 KB | BirthaDickens (talk | contribs) | 1 | |
| 13:01, 12 June 2012 | Oreilly 2012 datajournalismhandbook.png (file) |  |
139 KB | Iwolf (talk | contribs) | Book cover of Gray, J. and Chambers, L. and Bounegru, L., The Data Journalism Handbook, O'Reilly Media, 2012 | 1 |
| 20:12, 23 May 2012 | Social bookmarking service 2804.jpg (file) |  |
57 KB | IrisHelm8 (talk | contribs) | 1 | |
| 18:33, 23 May 2012 | Social bookmarking service 4109.jpg (file) |  |
183 KB | ThisBadMotherfuckerMclaughlin (talk | contribs) | 1 | |
| 13:49, 10 April 2012 | Flowingdata2012visualizethis.png (file) |  |
111 KB | Iwolf (talk | contribs) | [FlowingData, 2012] Nathan Yau, FlowingData, Retrieved at: April 10, 2012. http://book.flowingdata.com/ | 1 |
| 18:27, 2 March 2012 | Beautiful-visualization.jpg (file) |  |
164 KB | Iwolf (talk | contribs) | Book Cover "Beautiful Visualization" | 1 |
| 14:16, 10 January 2012 | Rosenthal-neu-tuc-160.png (file) |  |
29 KB | Paulrosee (talk | contribs) | 1 | |
| 15:15, 31 October 2011 | KirbyVisPanel2011.pdf (file) | 1.1 MB | Lebot (talk | contribs) | Slides by Mike Kirby for V&V panel at VisWeek 2011 | 1 | |
| 15:17, 19 August 2011 | Student loans 3006.jpg (file) |  |
135 KB | JeremyMoser2 (talk | contribs) | 1 | |
| 13:10, 15 June 2011 | Andreas Holzinger.jpg (file) |  |
19 KB | Aholzinger (talk | contribs) | 1 | |
| 23:07, 2 June 2011 | Electronic cigarette 4032.jpg (file) |  |
165 KB | SelinaOwen8 (talk | contribs) | 1 | |
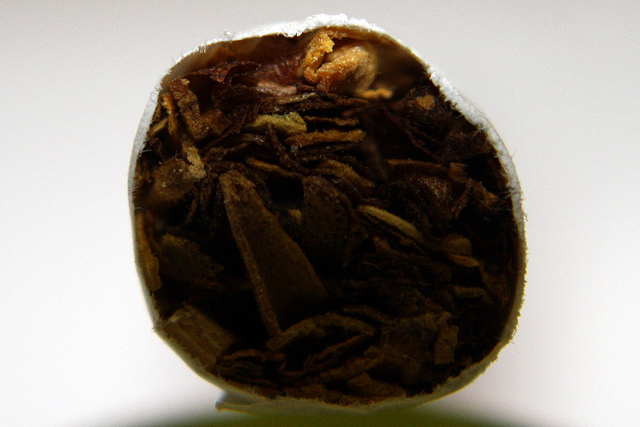
| 13:20, 2 June 2011 | Electronic cigarette 2165.jpg (file) |  |
121 KB | BesseHolmes8 (talk | contribs) | 1 | |
| 05:40, 2 June 2011 | Electronic cigarette 4060.jpg (file) |  |
148 KB | ForIrwin6 (talk | contribs) | 1 | |
| 22:06, 1 June 2011 | Electronic cigarette 3000.jpg (file) | 70 KB | AlonzoJeffries (talk | contribs) | 1 | ||
| 14:51, 2 March 2011 | Vizz.png (file) |  |
42 KB | ChristinaV (talk | contribs) | VizSec2011 Announces Call for Papers 8TH International Symposium on Visualization for Cyber Security to be held at Carnegie Mellon University in Pittsburgh, PA NORTHPORT, NY, February 2, 2011 – Organizers of VizSec2011, the international conference on | 1 |
| 01:52, 8 February 2011 | Certification 3647.jpg (file) |  |
70 KB | GranvilleMarin (talk | contribs) | 1 | |
| 00:11, 18 January 2011 | Linechart gr03 2.png (file) |  |
102 KB | UE-InfoVis1011 0927624 (talk | contribs) | 1 | |
| 00:09, 18 January 2011 | Linechart gr03.png (file) |  |
102 KB | UE-InfoVis1011 0927624 (talk | contribs) | 3 | |
| 22:19, 17 January 2011 | Group 6 scatterplot.jpg (file) |  |
60 KB | UE-InfoVis1011 0325435 (talk | contribs) | 1 | |
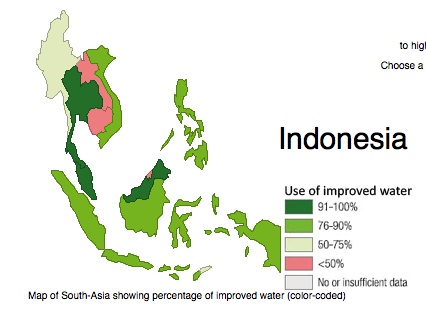
| 22:19, 17 January 2011 | Group 6 map.jpg (file) |  |
37 KB | UE-InfoVis1011 0325435 (talk | contribs) | 1 | |
| 22:18, 17 January 2011 | Group 6 lineplot.jpg (file) |  |
31 KB | UE-InfoVis1011 0325435 (talk | contribs) | 1 | |
| 22:01, 17 January 2011 | Barchart gr03.jpg (file) |  |
83 KB | UE-InfoVis1011 0927624 (talk | contribs) | Visualization of the Barchart | 1 |
| 22:00, 17 January 2011 | Barchart gr03.png (file) |  |
25 KB | UE-InfoVis1011 0927624 (talk | contribs) | Visualization of the Barchart | 1 |
| 18:36, 17 January 2011 | Screenshot job voyager.png (file) |  |
110 KB | UE-InfoVis1011 0526223 (talk | contribs) | 2 | |
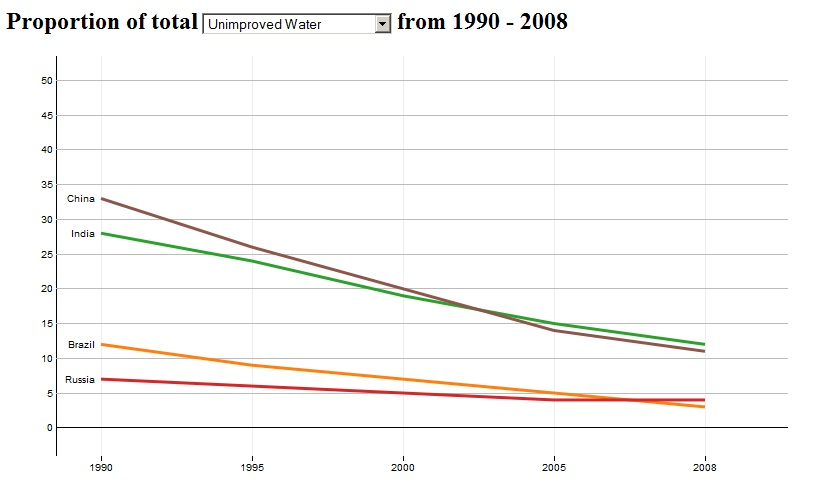
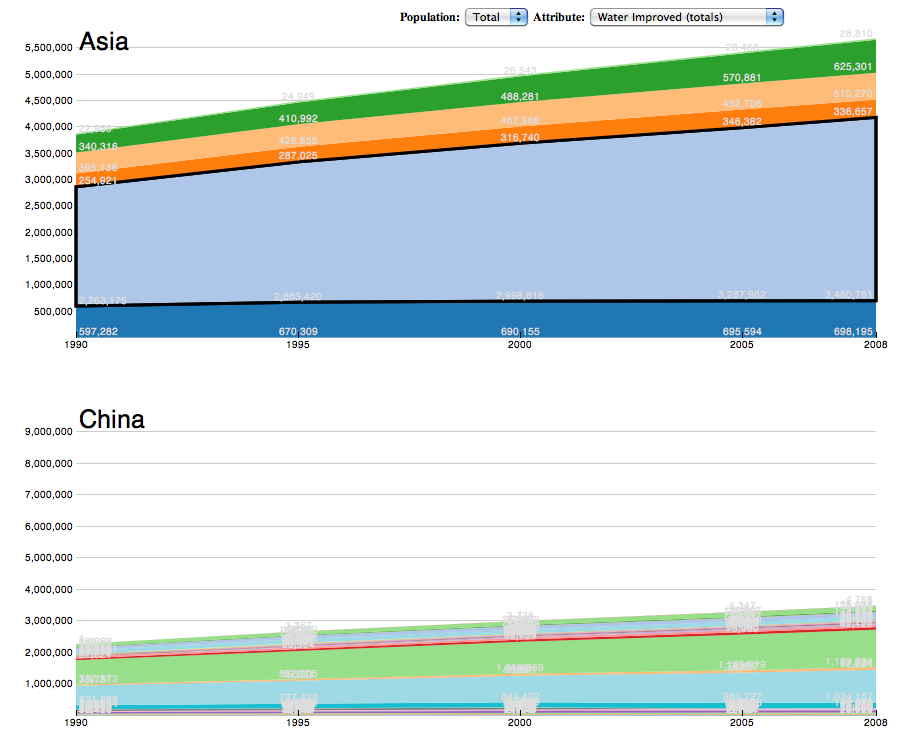
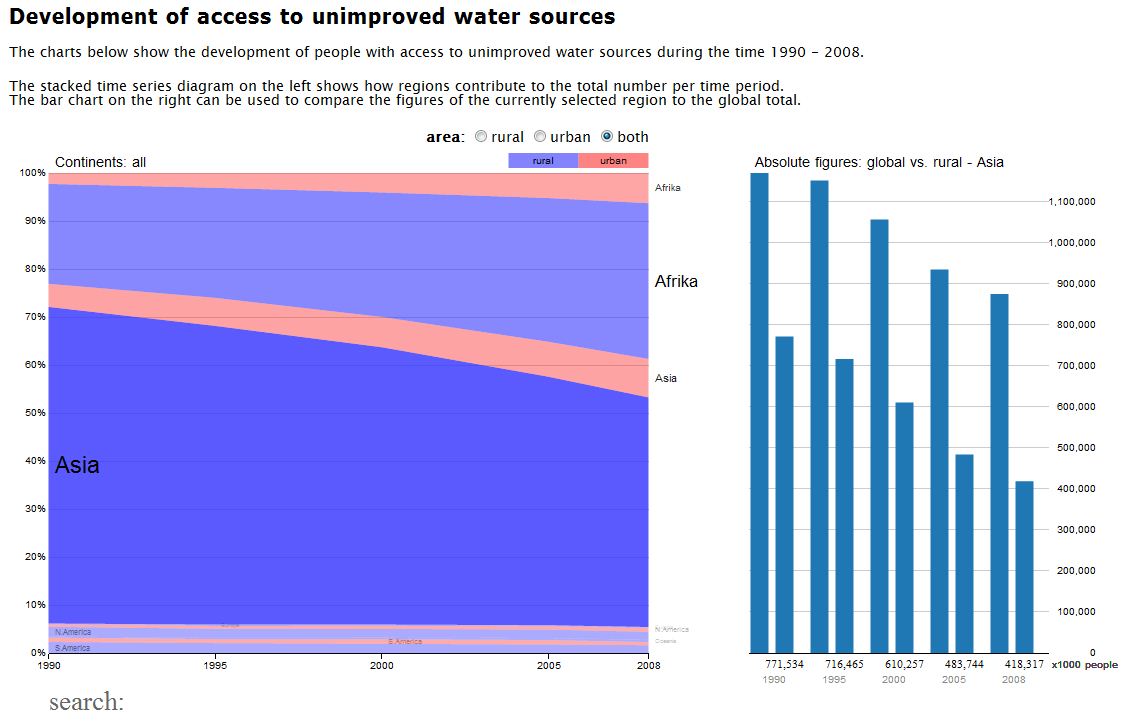
| 18:19, 17 January 2011 | Watervis-stackedtimeseries.jpg (file) |  |
101 KB | InfoVis1011 9925916 (talk | contribs) | The visualisation shows the development of access to unimproved water sources, based on data from the Joint Monitoring Program for Water Supply and Sanitation (JMP) of the World Health Organization (WHO) and the UN Children’s Fund (UNICEF). http://www.w | 2 |
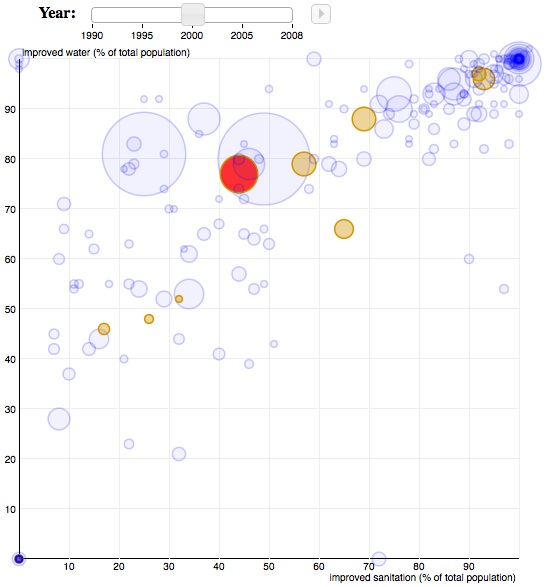
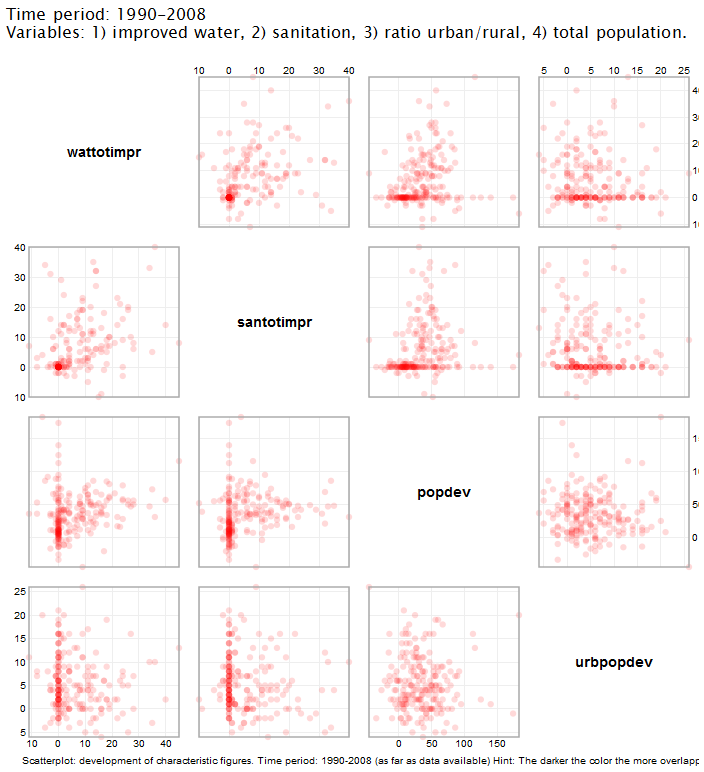
| 17:01, 17 January 2011 | ScatterplotKeyvariables.png (file) |  |
105 KB | UE-InfoVis1011 0326062 (talk | contribs) | The scatterplots show the change of monitored JMP-variables during the time 1990-2008. | 1 |
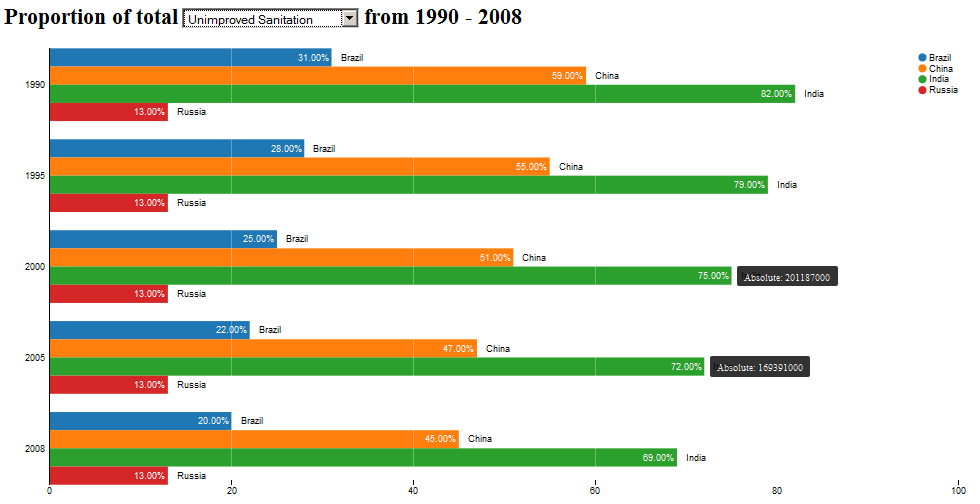
| 16:37, 17 January 2011 | Watervisbarchart.png (file) |  |
36 KB | UE-InfoVis1011 0326062 (talk | contribs) | The bar chart shows the improvement/decline of drinking water supply | 1 |
| 23:33, 15 December 2010 | No-credit-loans.pdf (file) | 52 KB | Uxaqaho (talk | contribs) | 1 | ||
| 22:21, 15 December 2010 | Cash-advance.pdf (file) | 26 KB | Ymexavu (talk | contribs) | 1 | ||
| 22:09, 15 December 2010 | Best-credit-cards.pdf (file) | 52 KB | Ymexavu (talk | contribs) | 1 | ||
| 22:37, 7 December 2010 | Free-credit-report-no-credit-card.pdf (file) | 53 KB | Unimemacid (talk | contribs) | 1 |