Teaching:TUW - UE InfoVis WS 2007/08 - Gruppe 08 - Aufgabe 2: Difference between revisions
Jump to navigation
Jump to search
(Table - Group8) |
No edit summary |
||
| Line 14: | Line 14: | ||
*[[Teaching:TUW - UE InfoVis WS 2007/08 - Gruppe 08|Gruppe 08]] | *[[Teaching:TUW - UE InfoVis WS 2007/08 - Gruppe 08|Gruppe 08]] | ||
==new Table== | |||
[[Image:Tab2_8_bezirk_klein.JPG]] | |||
==Kritik== | |||
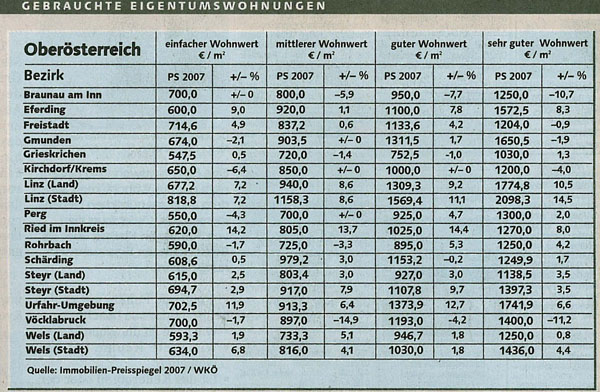
*white spaces – There are no white spaces, neither between columns nor between rows. | |||
*grid – The whole table is partet with one big black grid. It is not easy to find out witch data belong together. | |||
*fill color – There is a background color for the whole table in blue. But there is no fill color for specific data or to group data. It is difficult not to get confused in rows while tracking one. | |||
*table terminology – | |||
**header - in the header is redundant information („einfacher Wohnwert“, „PS 2007“). | |||
**Some information should be in the headline like „PS 2007“. The whole table is about PS 2007 and so the table is more difficult to read. | |||
*orientation – | |||
**the numbers in the lines „PS 2007“ represent quantitive values and should be places right. | |||
**alignment – percent should be aligned on the right side | |||
**Percentage signs – They should appear on the right of the percentage value. | |||
*headers – I don't know what exactly the headers should declare | |||
**„Wohnwert“ - is it the actual market place or something else | |||
**+/- % - is this the procentual change compared to the last year? | |||
**„gebrauchte Eigentumswohnungen“ - is it the value of needed flats or the value of used flats? | |||
**was genau bedeutet „sehr gut“, „gut“? Eine Aufschlüsselung dessen wäre sinnvoll | |||
==Modifications== | |||
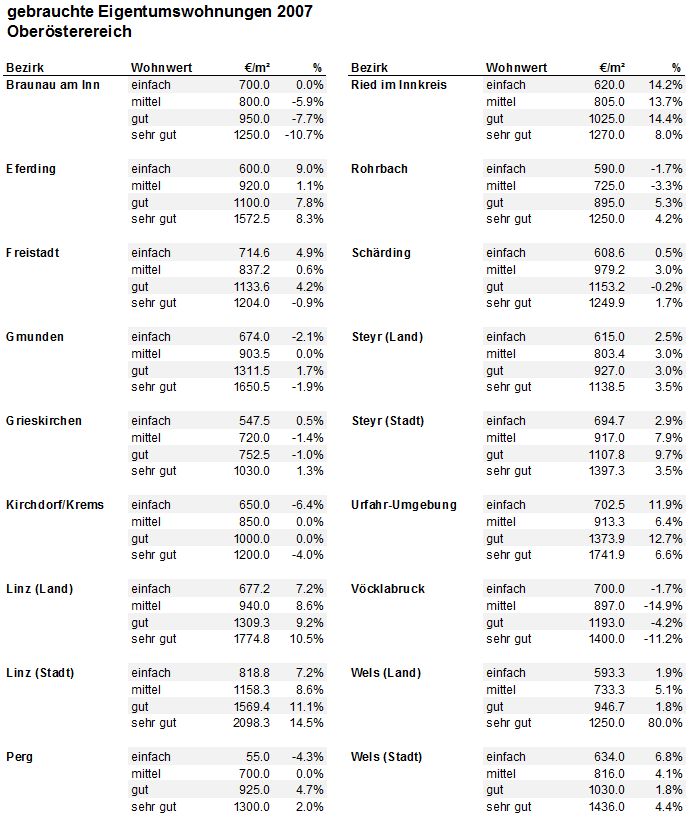
*The whole table was redesigned. Je nachdem was in der Tabelle als wichtig erscheint ist eine andere Art der Darstellung zu wählen. In der folgenden Lösung sind die Daten der einzelnen Bezirke in sich leichter zu vergleichen. ZB ist hier ersichtlich, dass in Braunau am Inn der Wohnwert in sehr guten Wohnungen. | |||
*headers besser gewählt – eine grosse und lauter kleine ueberschriften | |||
*fill color – every 2nd line is colored | |||
*white spaces – are used between seperate bezirke | |||
*eine gesamtueberschrift (bezirk, wohnwert ...) | |||
*background color – neutral | |||
*bezirke fett geschrieben damit sie schneller findbar sind | |||
==Improvement== | |||
*sinnvollere ueberschriftenwahl | |||
*lesbarer aufgrund der formatierung (nicht in zeilen, sondern wichtiges auf einem haufen) | |||
*white spaces between data welche nicht zusammen gehoeren | |||
*keine schwarzen rules mehr | |||
*nicht so viele daten in zeilen | |||
*vergleichbare daten nebeneinander, untereinander | |||
Revision as of 18:27, 23 November 2007
Aufgabenstellung
Zu beurteilende Tabelle
Links
new Table
Kritik
- white spaces – There are no white spaces, neither between columns nor between rows.
- grid – The whole table is partet with one big black grid. It is not easy to find out witch data belong together.
- fill color – There is a background color for the whole table in blue. But there is no fill color for specific data or to group data. It is difficult not to get confused in rows while tracking one.
- table terminology –
- header - in the header is redundant information („einfacher Wohnwert“, „PS 2007“).
- Some information should be in the headline like „PS 2007“. The whole table is about PS 2007 and so the table is more difficult to read.
- orientation –
- the numbers in the lines „PS 2007“ represent quantitive values and should be places right.
- alignment – percent should be aligned on the right side
- Percentage signs – They should appear on the right of the percentage value.
- headers – I don't know what exactly the headers should declare
- „Wohnwert“ - is it the actual market place or something else
- +/- % - is this the procentual change compared to the last year?
- „gebrauchte Eigentumswohnungen“ - is it the value of needed flats or the value of used flats?
- was genau bedeutet „sehr gut“, „gut“? Eine Aufschlüsselung dessen wäre sinnvoll
Modifications
- The whole table was redesigned. Je nachdem was in der Tabelle als wichtig erscheint ist eine andere Art der Darstellung zu wählen. In der folgenden Lösung sind die Daten der einzelnen Bezirke in sich leichter zu vergleichen. ZB ist hier ersichtlich, dass in Braunau am Inn der Wohnwert in sehr guten Wohnungen.
- headers besser gewählt – eine grosse und lauter kleine ueberschriften
- fill color – every 2nd line is colored
- white spaces – are used between seperate bezirke
- eine gesamtueberschrift (bezirk, wohnwert ...)
- background color – neutral
- bezirke fett geschrieben damit sie schneller findbar sind
Improvement
- sinnvollere ueberschriftenwahl
- lesbarer aufgrund der formatierung (nicht in zeilen, sondern wichtiges auf einem haufen)
- white spaces between data welche nicht zusammen gehoeren
- keine schwarzen rules mehr
- nicht so viele daten in zeilen
- vergleichbare daten nebeneinander, untereinander

