Visualization of Mappings between Schemas
Authors
- George Robertson
- Mary Czerwinski
- John E. Churchill
Short description
Figures
The following visualization improvements are used to solve the problem.
Highlight Propagation
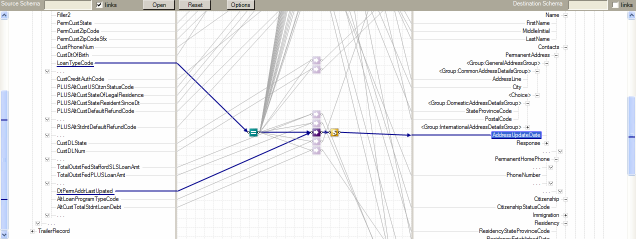
Whenever an item (schema element, link or functoid) is selected propagate highlighting is used. Propagation means that all links are followed in both directions, and every item that is relevant to the selected is highlighted as well. In addition all the links and functoids that are not highlighted are de-emphasized.
The problem is that the functoids or schema elements of interest are not visible. In this case auto-scrolling is used.
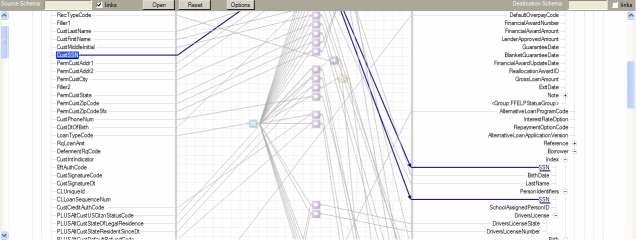
Figure 1: Highlight propagation after selecting element.
Auto-scrolling
There are three kinds of auto-scrolling to the Schema Mapper visualization.
These are:
- Auto-scroll Map
- The map is auto-scrolled so that the mid-point between the top-most and bottom-most highlighted functoids is vertically centered on the vertical position of the selected element.
- Auto-scroll Columns within Map
- When the map is auto-scrolled, often the functoids along the selected path (between source schema element, functoids, and destination schema element) are not aligned. To address this problem a technique originally suggested by the Cone Tree visualization is used. Each column of the map is moved so that the next functoid on the selected path is centered on that path. This is only done for the top-most highlighted functoid in each column. The result is that the entire selected path is centered on the originally selected schema element.
- Auto-scroll Schema Tree Views
- We also need to center the highlighted schema element(s) in the related schema. A modified TreeView control is used which supports centering of a node or animated scrolling.
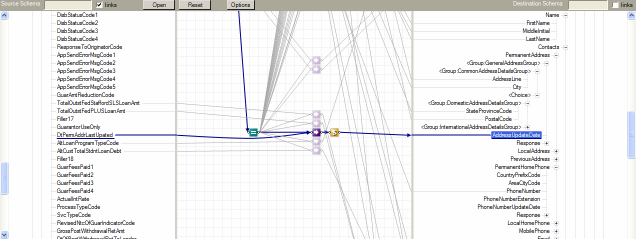
Figure 2: Auto-scrolling of map, columns, and schemas.
Figure 2 shows the effects of these three techniques after selecting a destination schema element. But we still have the problem that highlighted schema elements may not be visible because the distance between the related elements is too large.
Coalescing Trees
To address this problem a method for coalescing nodes that are not relevant at the moment is used. Schema Mapper uses implicit relevance based on two factors: whether a schema element or any of its descendants has a link, and the selected and highlighted schema elements. Hovering over a coalesced node produces a tooltip that describes what has been coalesced. When you click on the node’s down arrow the coalesced nodes are made visible.
Multi-Select
The capability of selecting multiple elements has been added to the Schema Mapper visualization. The first selection is done with a single click of the mouse button. Additional selections are done with a mouse click while holding down the Shift key.
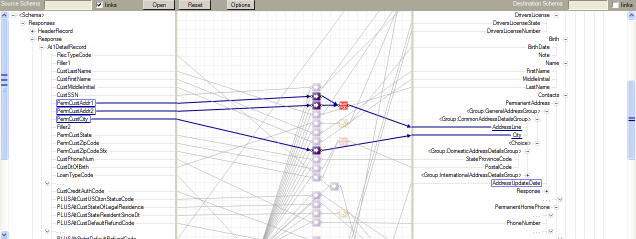
Figure 4: Multi-selection of three source schema elements.
Incremental Search
A search type-in box has been added above each schema, along with a checkbox to indicate whether to search only on linked elements or on all elements. The search is incremental, in that it shows the results after each keystroke in the search box.
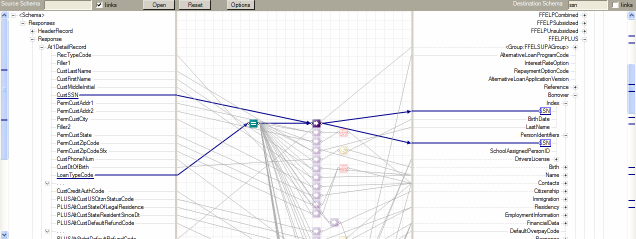
Figure 5: Search for “ssn” in destination schema.
Automatic Parental Tree View Collapse is used to show only the nodes that have search hits or have descendants with search hits. All other nodes should be collapsed.
Interactive Scrollbar Highlighting is used to represent all of the search hits with tick marks in the scrollbars. These tick marks are interactive. If you hover over one, a tooltip will describe the element. If you click on one, the desired element will be centered. Blue tick marks represent selected elements and red marks represent unselected search hits.
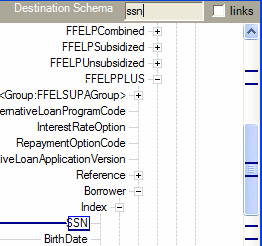
Figure 6: Search type-in box and scrollbar highlights.
Bendable Links
When a highlighted path between schema elements passes directly behind a functoid the link will be visually bended around the functoid.

Figure 7: Close-up of bent link.
Focus on Linked Elements
The use of the up/down arrow keys to advance to the previous/next element has been modified to advance to the previous/next linked element. If the user holds down the Shift key the original behavior is performed.
Suitable Datatypes
These methods can be used to visualize mappings between XML schemas.
Evaluation
A fully functional prototyp of the tool was built with the ability to turn on and off particular features. Eight very experienced BizTalk users were recruited for participation.
Results
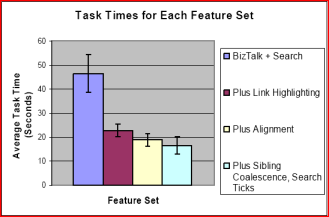
Figure 8: Average task times for each of the four feature sets.
Figure 8 shows us that the original Schema Mapper without the activated features described above was significantly slower than each of the other feature sets.
References
[ George Robertson, Mary Czerwinski, John E. Churchill] Visualization of mappings between schemas, 2005.
Evaluation Reference
[ George Robertson, Mary Czerwinski, John E. Churchill] Visualization of mappings between schemas, 2005.
