The InfoVis Toolkit
Summary
Author: Jean-Daniel Fekete / University Paris-Sud
Project Webpage: http://ivtk.sourceforge.net
Current Version: 0.9 beta2, July 24, 2006
Requirements: Java 1.4
Overview: using Java2D graphics library; pipeline architecture; animation and rendering support
Base data structure: table of columns; columns contain objects of equal type; trees and graphs are derived from tables
Included visualization techniques: Scatter Plot; Time Series Plot; Parallel Coordinates; Node-Link Diagram; Icicle Tree; Treemap; Adjacency Matrix
Supported File Formats: CSV, XML, TQD, Newick, TM3, DOT, XML TreeML, XML GraphML
The InfoVis Toolkit is an interactive graphical open source toolkit written in Java. It is thought to support the development of Information Visualizations which are based on a high amount of data. To provide a fast and efficient processing of these data, special attention was set to the underlying data structure. As the internal structure of the InfoVis Toolkit considers the Visualization Pipeline, a data table was chosen to store all information. A table allows representing nearly every kind of data. Also interrelations between records can be established by using parent and children columns. The InfoVis Toolkit supports a graph structure as well as a tree structure.
Generally, the table was optimized regarding to memory footprint and data access speed. This was obtained by using arrays of the respective type as columns and metadata which describes the column itself. In contrast to other implementations of tables (e.g., Java Swing Table) this approach provides a measurable advantage in memory usage and access performance. But, these performance enhancements are paid with less comfort in using the table and handling single tubles or records in it.
The design of the InfoVis Toolkit can be seen as polylithic. Even though the Visualization Pipeline is considered internally, nevertheless, there are no clearly defined points in the logic where a user can place its own functionality (in contrast to other toolkits like prefuse for example). Applying own filters or rendering routines may enforce deep changes in the base functionality. Furthermore, the class hierarchy is very deep and complex. So, even small extensions of the predefined functionality may cause a lot of adaptation work in several classes.
However, realization of own complex visualizations which require a lot of special functionality may be hard work and enforces developer to understand the internal structure of the toolkit itself. But, there are a lot of predefined visualization techniques that help to visualize data in a common way like scatter plots or treemaps. The toolkit provides a lot of examples that illustrate the appliance of such standard visualization techniques to own data sources.
Pros
- low memory usage
- fast data access, only a few typecasts are needed
- metadata to describe columns and tables
- internal pipeline approach
- many visualization techniques included
- several data reader for common formats included
- algorithms for force-based physics simulation included
- query language to navigate within abstract data
- demos and examples included
- open source
Cons
- polylithic design takes up more time to conceive and see first results
- missing expected functionality (e.g., a row object in tables)
- special requirements of visualization enforce a lot of adapting work
- the design is hard to conceive, the logic not clear
- no clear points defined to place own code
- poor documentation
- no user community
- most examples are buggy (especially controls)
General Approach
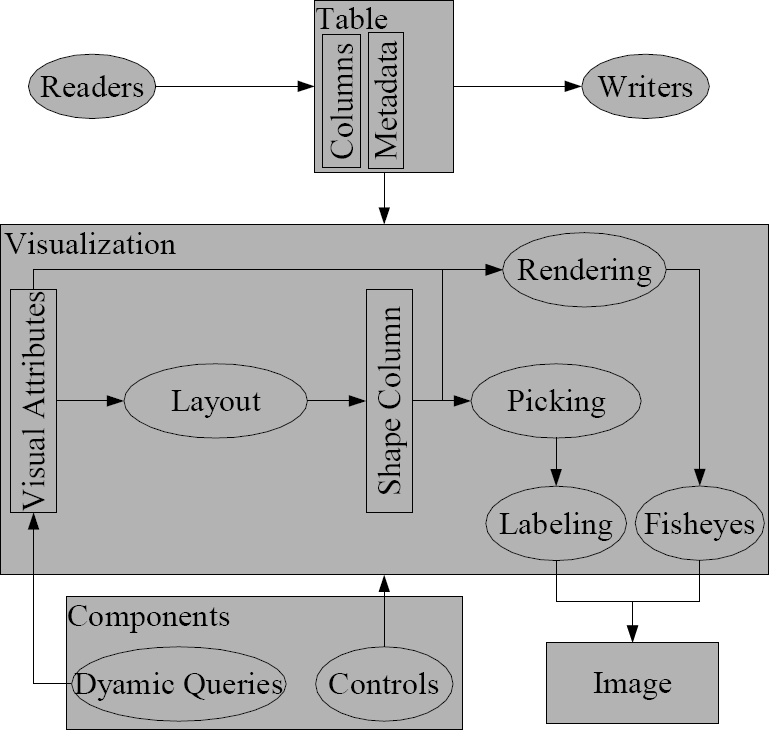
An Information Visualization done with the InfoVis Toolkit is based on a table which stores the abstract data:
The proper functionality of the toolkit is maintained by an object called Visualization. This component is responsible for transforming the abstract data of the Table to visual analogues. The associations between abstract content and visual analogous are described with attributes. Each used attribute is associated with a certain Column of the Table. Further, an ItemRenderer provides the painting routines of an item. After all items are layouted, the resulted shapes are stored in the ShapeColumn within the Visualization.
The view of a visualization is the VisualizationPanel. This graphical component can be embedded in each Java Swing application. However, there is no need to use this panel, also other targets like a BufferedImage or a standard JComponent can be taken to communicate the output to the user.
Controlling of the visualization is done by manipulating mapped columns of the Table, by manipulating Renderers, or by setting dynamic queries to filter the visual content. The toolkit has got a large set of interaction controls predefined. Most attention was set toward providing own panels which combine several interaction possibilities (e.g., color chooser, filter for all defined columns, etc.). Such control panels are typically organized in tab groups around the proper visualization. Further, the VisualizationPanel can be extended by control listener to handle mouse or keyboard events manually. If a certain item should handle such an event, the respective renderer must provide this functionality.
Readers and Writers
Readers and Writers are associated with a Table. The toolkit provides a lot of different readers for common file formats like XML or CSV. Predefined readers or writers already consider the internal structure of the associated file, so, XML files are stored in a tree, CSV in a table, etc.
Table
The Table is the base container for every kind of abstract data. In contrast to other implementations of tables, this table is not based on containers like vectors or hashtables. Instead, it consists of several Columns which are technically arrays of the respective data type they should map. Additionally, each column is described with metadata:
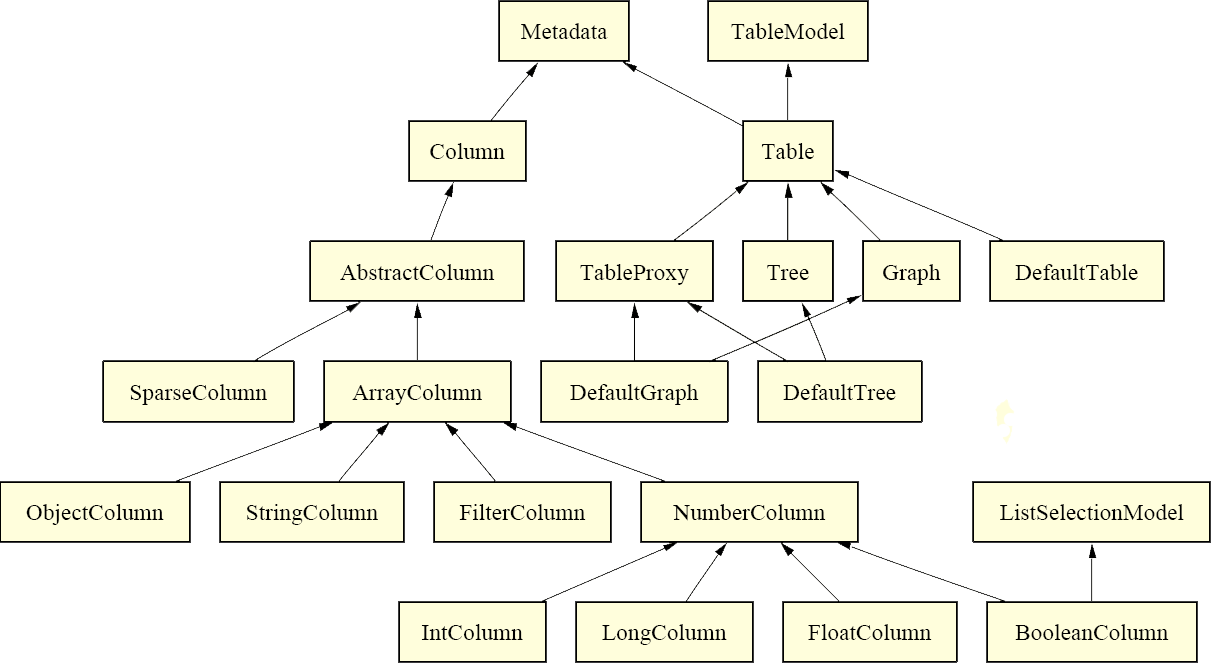
Several Columns to map standard types like Strings or Integers are already predefined. The ObjectColumn can store each thinkable Java Object. Therefore, a tuple in the table is composed of several differnt objects that may contain own data again.
As an array is indexed, the table itself has indexes too. The index is used to access the data records, further, relations as needed by Trees or Graphs are also established through indexes. A Column can have empty rows which is important in case of sparse data.
A generally row object to fill or access data is missing, so, a data record can only be accessed by requesting the data of all columns with the index. Thus, especially when dealing with sparse data, special attention has to be paid toward filling the table.
Visualization
The Visualization is bound to the Table. Semantic attributes which are defined in associated columns of the Table are transformed into visual attributes (e.g., color, label, etc.). Filtering of abstract content to visual attributes is managed by dynamic queries which are used to determine which data is visualized and which not.
Most of the assignments attributes (like size, stroke width, etc.) are defined in own columns too. Locations of the items are typically calculated by layout algorithms. This can be done by the Visualization itself or an associated Layout object. Once, all visual attributes of an item are retrieved of the table or calculated by algorithms, they are stored in the internal ShapeColumn.
The ShapeColumn is only updated when it is required. This happens on following events:
- The Table has changed. The Visualization is notified whenever records of the Table have changed, new ones were inserted, or existing ones were deleted.
- A user-interaction forces a new layout of the items.
- A user-interaction changes the filtering process.
Painting itself is done by Renderers. Each Visualization has an associated Renderer which can consist of several other Renderers again. A Renderer provides the painting routines for an item which are based on the visual attributes of the Visualization. Further, a Renderer may also handle user interactions (e.g., clicking on an item).
Before an item is actually painted, also other visualization techniques may influence the output. Examples for such techniques are fisheye views or dynamic labeling.
Components
In Components a large set of interaction components are concentrated. Predefined components are combined within own control panels and include sliders to change size or colors of items, components to set filter expressions, or handler to select items. Such interactions are typically applied by using dynamic queries or changing visual attributes manually.
Note, that interactions in the InfoVis ToolKit may change columns in the underlying table. Further, the table is also used to store flags that indicate the actual state of an item.
Image
The image is the visual output of the Information Visualization. In contrast to other toolkit, the InfoVis Toolkit does not demand a certain component to render its output. Painting is done by using the Java Graphics2D environment. Therefore, also a BufferedImage can be used for example. However, the default view is the VisualizationPanel and derivates of it. A VisualizationPanel is a JComponent, therefore, the view also inherits the functionality of the Swing component. This component also supports events on the view that can be handled by the view itself or delegated to the respective Renderer or other event handler.
The InfoVis Toolkit partially supports the Agile2D graphics framework which allows faster paintings of 2D graphics.
Details
Package Structure
- io
- basic readers and writers.
- metadata
- several metadata categories.
- panel
- contains several "view" implementations and components that provides interaction possibilities.
- visualization
- this package contains several implementations of Visualizations and other basic classes like interfaces for layouts. Further, Renderer and other helper classes are included here.
- column
- provides the basic implementation of a Column and special derivates of it.
- table
- provides a set of classes related to visualization of tables.
- tree
- provides a set of classes related to visualization of trees.
- graph
- provides a set of classes related to visualization of graphs.
- utils
- contains several helper classes like comparators, etc
Conclusion
The InfoVis Toolkit is a toolkit, which pays most attention toward saving resources. Even if there is a measurable advantage in comparison to other toolkits, there are other factors like usability or simplicity too that characterize a good toolkit. The toolkit is very hard to use, at least there is no underlying logic a developer can conceive quickly. But, the toolkit provides a lot of examples for standard problems, like scatter plots, etc. These predefined applications are easy to use if no special demands of the Information Visualization are needed. Nevertheless, many included examples are buggy or partially not runable anyway. When using a predefined sample, an exact testing is necessary.
External links
References
- [Fekete, 2004] Jean-Daniel Fekete. The InfoVis Toolkit. Proceedings of the 10th IEEE Symposium on Information Visualization (InfoVis'04), Austin, TX, IEEE Press. pp. 17-24, Oct 2004.
- [Fekete, 2003] Jean-Daniel Fekete. The InfoVis Toolkit (Rapport de Recherche) Research Report RR-4818, INRIA Futurs, May 2003.
- [Fekete, 2004] Jean-Daniel Fekete, user manual. Retrieved at: July 06, 2006, http://ivtk.sourceforge.net/manual.html

