Teaching:TUW - UE InfoVis WS 2009/10 - Gruppe 12 - Aufgabe 4
Aufgabenstellung
Zu erstellende Visualisierung
- Stammbaum der Nachkommen von Lisa und Bart Simpson*
...Visualisierung der Nachkommen von Lisa Simpson sowie der Nachkommen von Bart Simpson. Dabei sollen zwei Stammbäume entstehen - einer von Bart und einer von Lisa - die dann miteinander verglichen werden können. Zuerst kommen Lisa und Bart, dann deren Kinder, ihre Enkel, etc. (mind 4 Generationen). Da es noch keine Nachkommen gibt, können diese frei erfunden werden.
Die Visualisierung soll folgende Informationen darstellen:
- Verwandtschaftsverhältnisse (zumindest Eltern-Kinder),
- Unterscheidung zwischen Blutsverwandtschaft und angeheirateten Familienmitgliedern,
- Geburts- und Todestag sowie Lebensdauer von allen Familienmitgliedern,
- wichtige Ereignisse im Leben jedes Familienmitglieds (z.B., Anzeigen, Gefängnisaufenthalte, Schulzeit, Studienzeit, Nobelpreise, Arbeitslosigkeit etc.)
- Zufriedenheit jedes Familienmitglieds (Skala: sehr niedrig - niedrig - mittel - hoch - sehr hoch); kann sich im Laufe des Lebens ändern.
Die Visualisierung soll die interaktive Auseinandersetzung mit den Daten ermöglichen. Verpflichtend: Möglichkeiten zum besseren Vergleich von einzelnen Abschnitten der Stammbäume bzw. Vergleich von Ausschnitten aus Lisas und Barts Stammbäumen. + mind. 2 weitere Interaktionsmöglichkeiten (z.B., Details on Demand, Filteroptionen)
Allgemein:
- Die Daten sollen zur Analyse von Zusammenhängen zwischen Familienverhältnissen, wichtigen Ereignissen und Zufriedenheit visualisiert werden (die Anwendungsgebiets- und Zielgruppenanalyse kann kurz gehalten werden).
- Die bisher erlernten Design-Prinzipien sollen umgesetzt werden z.B.: Optimierung der Data-ink ratio (keine Comics!), visuelle Attribute (Größe, Farbe, Position, etc.) sollen sinnvoll eingesetzt werden (Information darstellen).
- Die Mockups sollten zumindest 1) die beiden Stammbäume im Überblick und 2) eine detaillierte Vergleichsansicht von 2 Teil-Stammbäumen wiedergeben.
- Alle nicht angeführten Daten können frei erfunden werden.
Analysis
Field of Application and Analysis of the Data Set
Field of Application
Family trees were originally used to show how certain royal families are intertwined and to show whom a person in the tree is heir to. Nowadays they are mostly used for genealogical research. The most common visualization of a family tree is, as the name suggests, a tree which displays various persons as nodes and those relations by edges connecting the respective nodes. The current generation is usually represented by the leaves of the tree. In order to visualize a marriage, either both persons are represented by a node, or a special marriage edge connecting the respective persons and the eventually resulting children is used.
The main drawback of a family tree is the incapability to display temporal data. For this reason special considerations have been made to display the temporal data just as well as the relational data, while maintaining the advantages of a conventional family tree.
Analysis of the Data Set
| Variable | Granularity | Scale | Data type |
|---|---|---|---|
| Family relationship | Discrete | Nominal | Tree |
| Consanguinity | Discrete | Nominal | Tree |
| Events or periods of life | Discrete | Interval | Temporal |
| Satisfaction level | Discrete | Ordinal | 1-dimensional |
The data set is subject to an one dimensional, multivariate data structure. The family relationships, consanguinities, events, periods of life and satisfaction levels are dependent on the temporal dimension and for this reason multivariate.
Analysis of the Target Audience
The target audience mainly consists of genealogical researchers, either professionals or hobbyists. Additionally the visualization can even be of use for psychological, social and medical research due to the additional level of information which is offered by the time-dependent satisfaction level. The research of inheritable diseases or rather the risk to be affected by those or more generally the genetic research seems also conceivable.
The variety of possible application areas demands a visualization which is designed in such a way that it can be used by inexperienced hobbyists, as well as sophisticated professionals from all areas in an intuitive, yet powerful manner.
Purpose of the Visualization
The visualization provides a representation of the genealogies of several persons by enriching the conventional family tree with interactive features. It's main purpose is the detailed depiction, just as well the comparison of family relationships which can be of use for genealogical research.
The visualization is furthermore capable to display important events (such as birthdays, days of death, etc.), life periods (such as schooldays) and the satisfaction level dependent on the period of life offering an additional depth of information which can be of interest for psychological, medical and social researchers (like mentioned above).
Concept
Type of Visualization
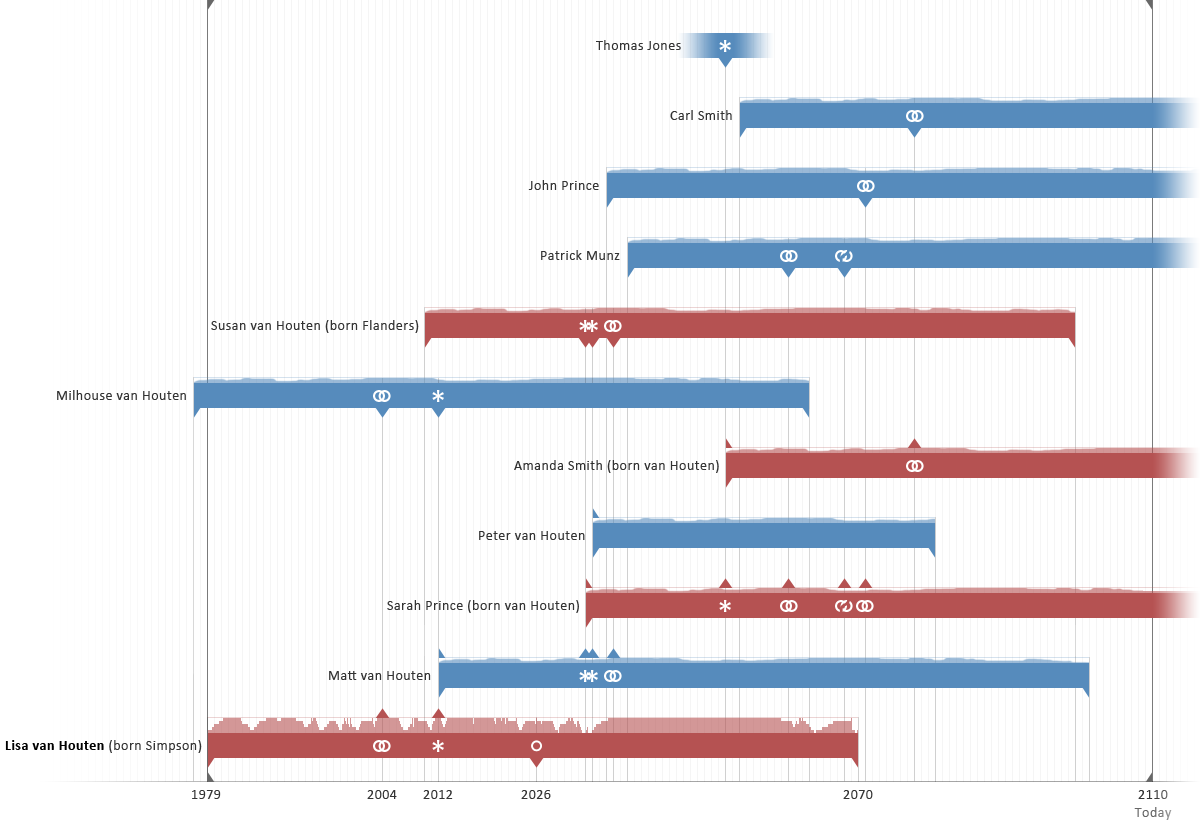
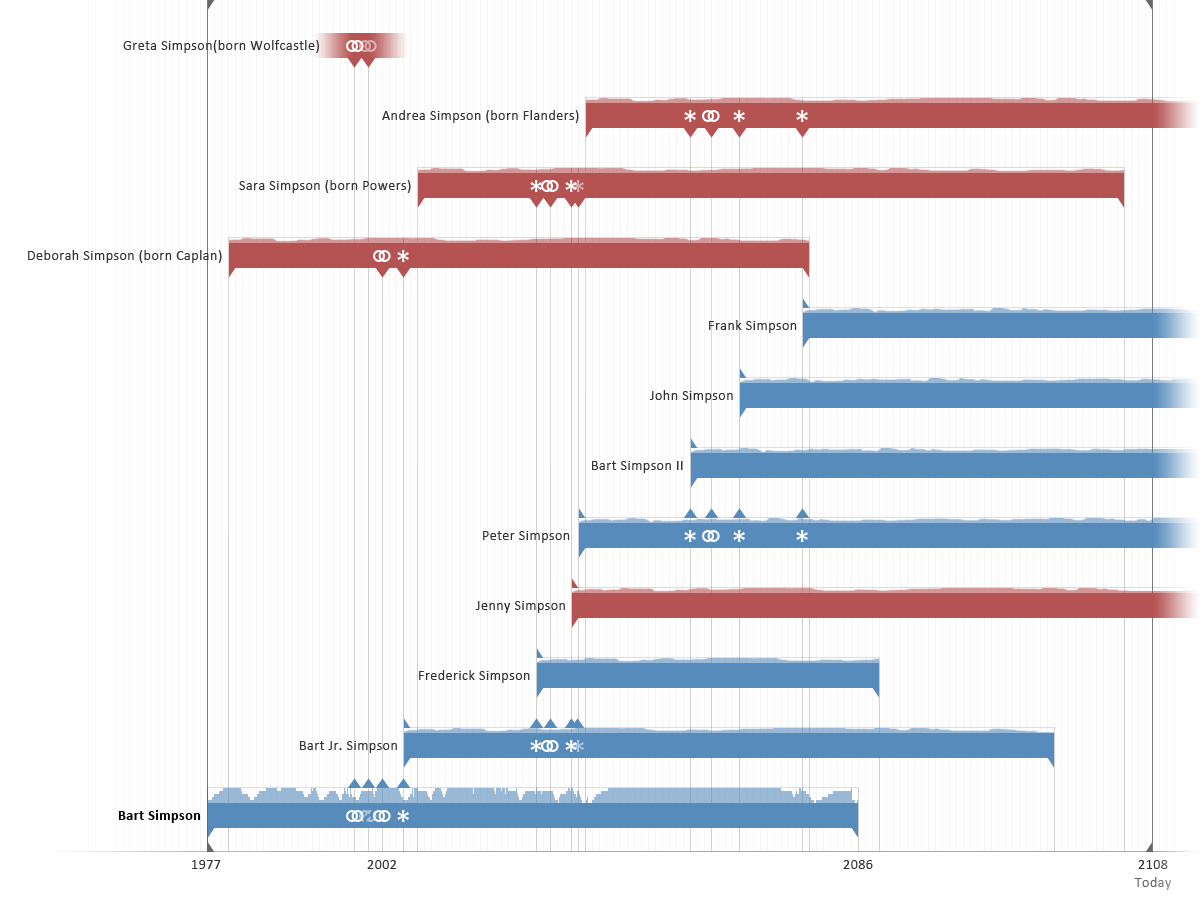
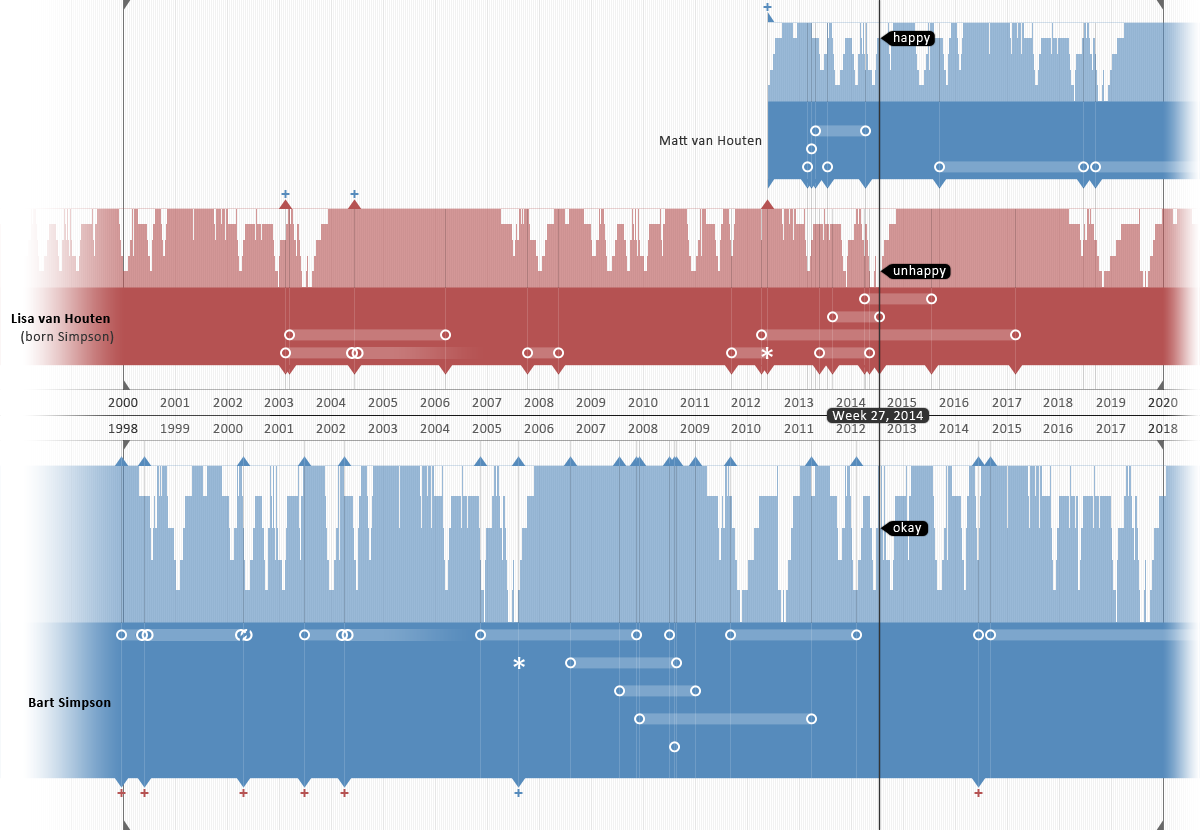
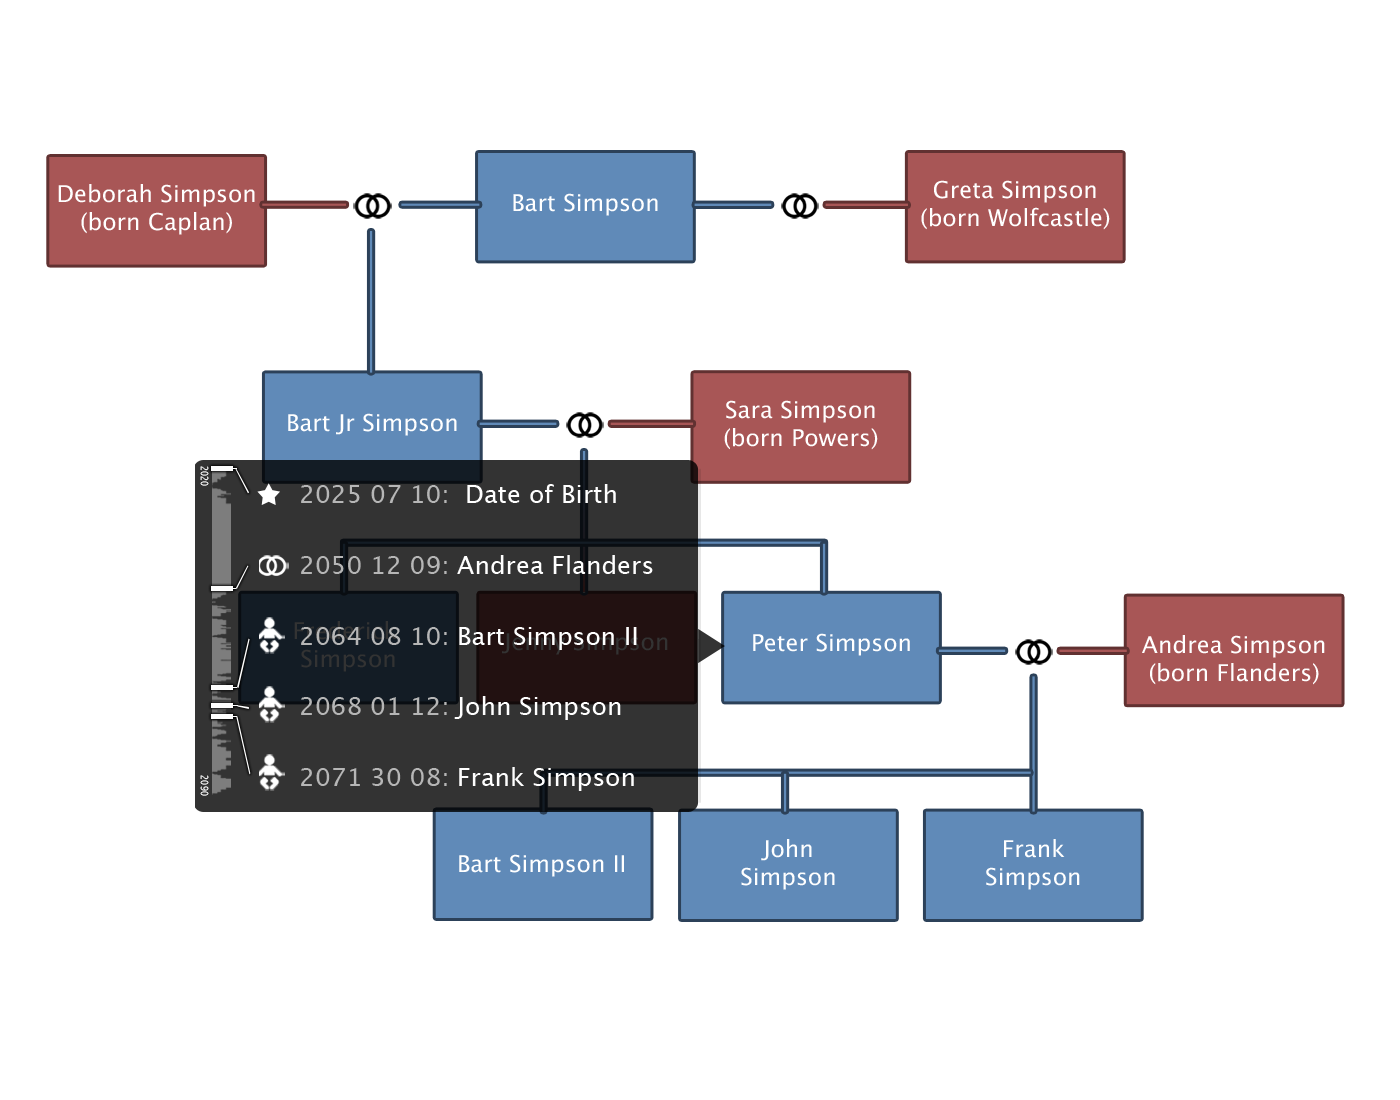
The main view of the visualization consists of time-lines, each visualizing the personal history (including important events, periods of life and the satisfaction level) of a person dependent on time. The integration of relational data has been realized with relational events, such as marriages and births. These can be regarded as the edges of the time-lines, comparable to the edges of a conventional tree. Related time-lines (comparable to nodes), and therefore persons, are connected by those relational events implying the temporal occurrence of the event in question.
The visualization can be regarded as conventional hierarchical family tree rotated by 90 degrees with its nodes and edges positioned and shaped according to the temporal data of the respective persons and events.
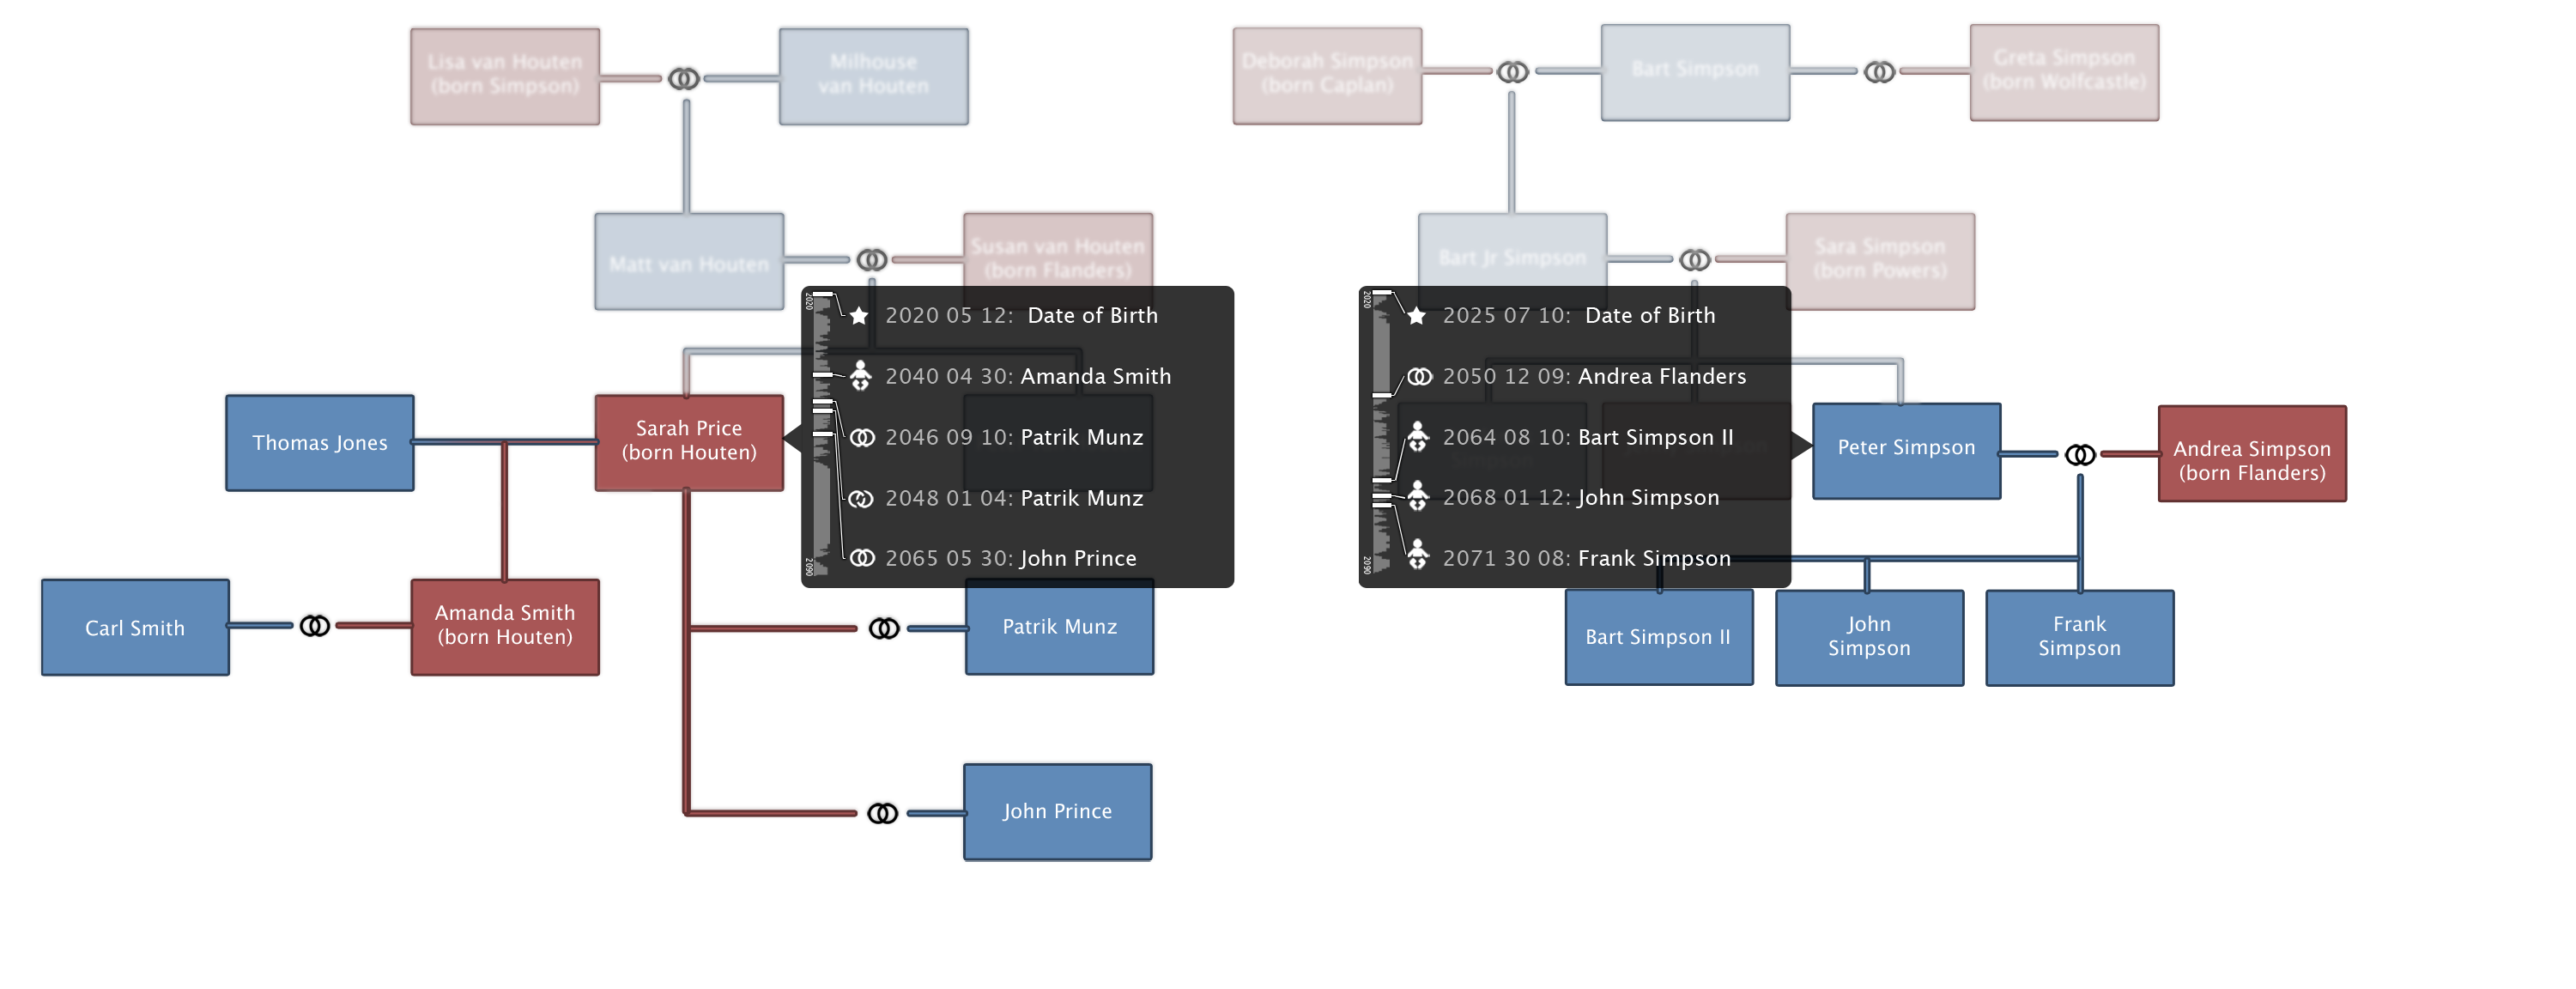
The comparison of multiple family trees is realized in a straightforward manner. It is possible to display multiple trees one below the other, each having it's own timescale.
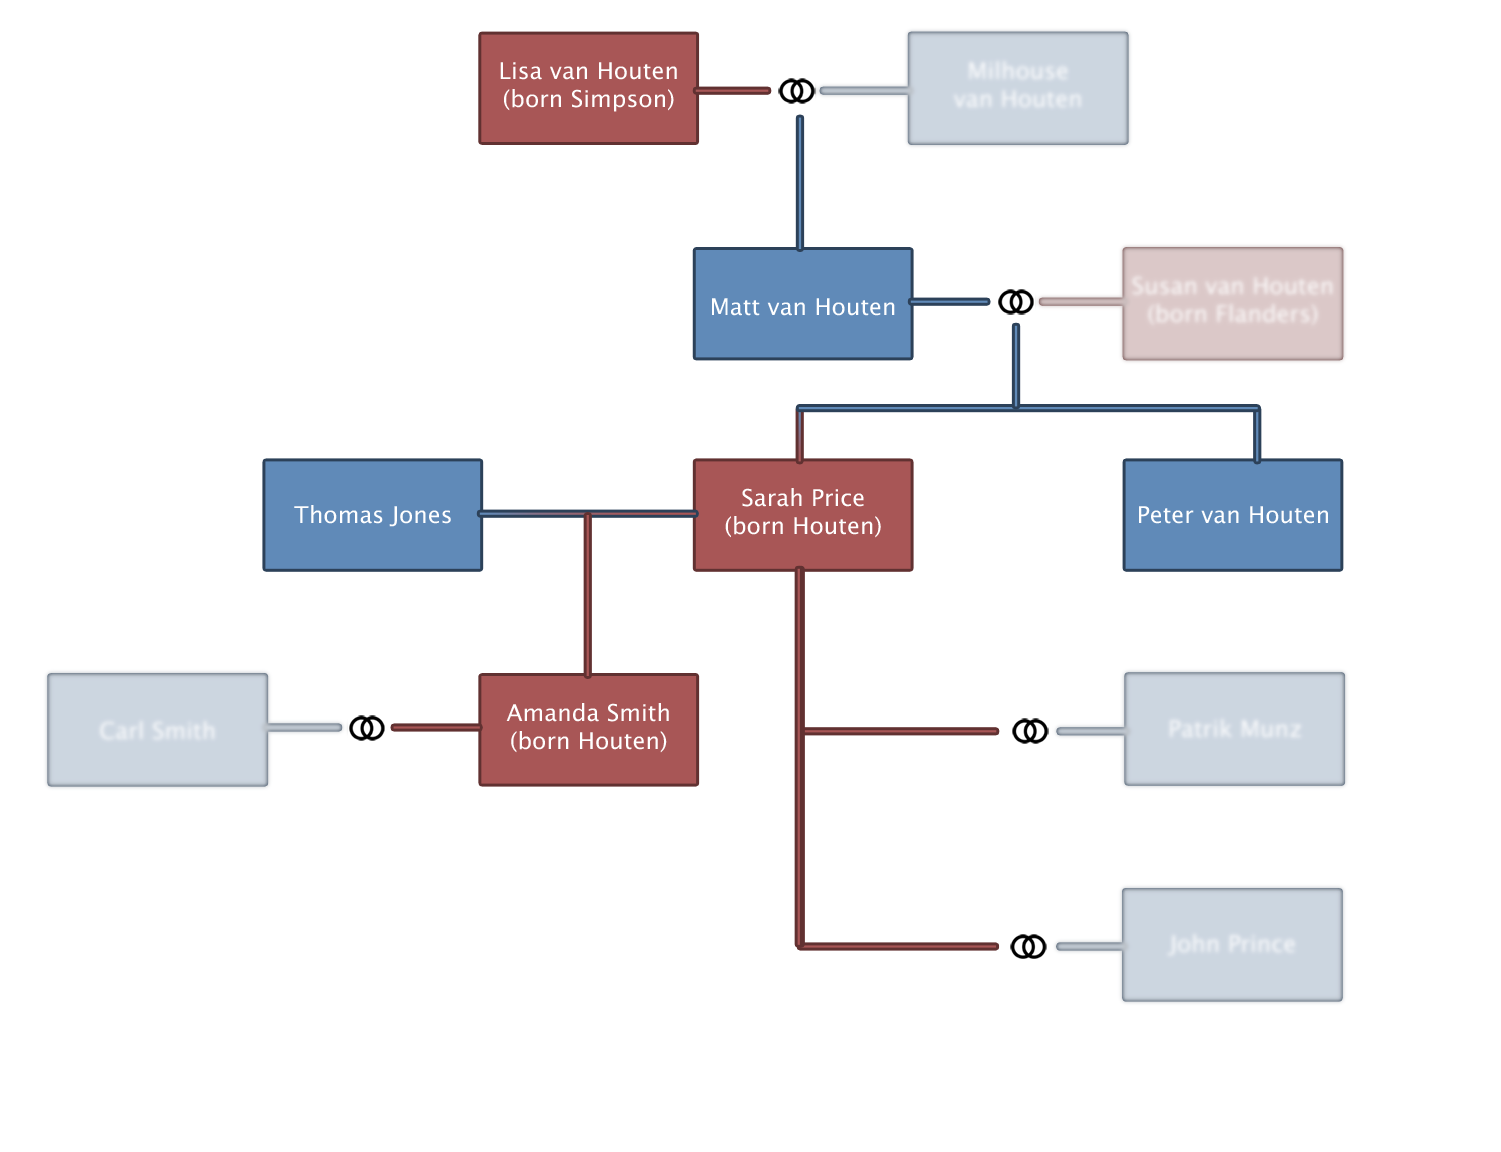
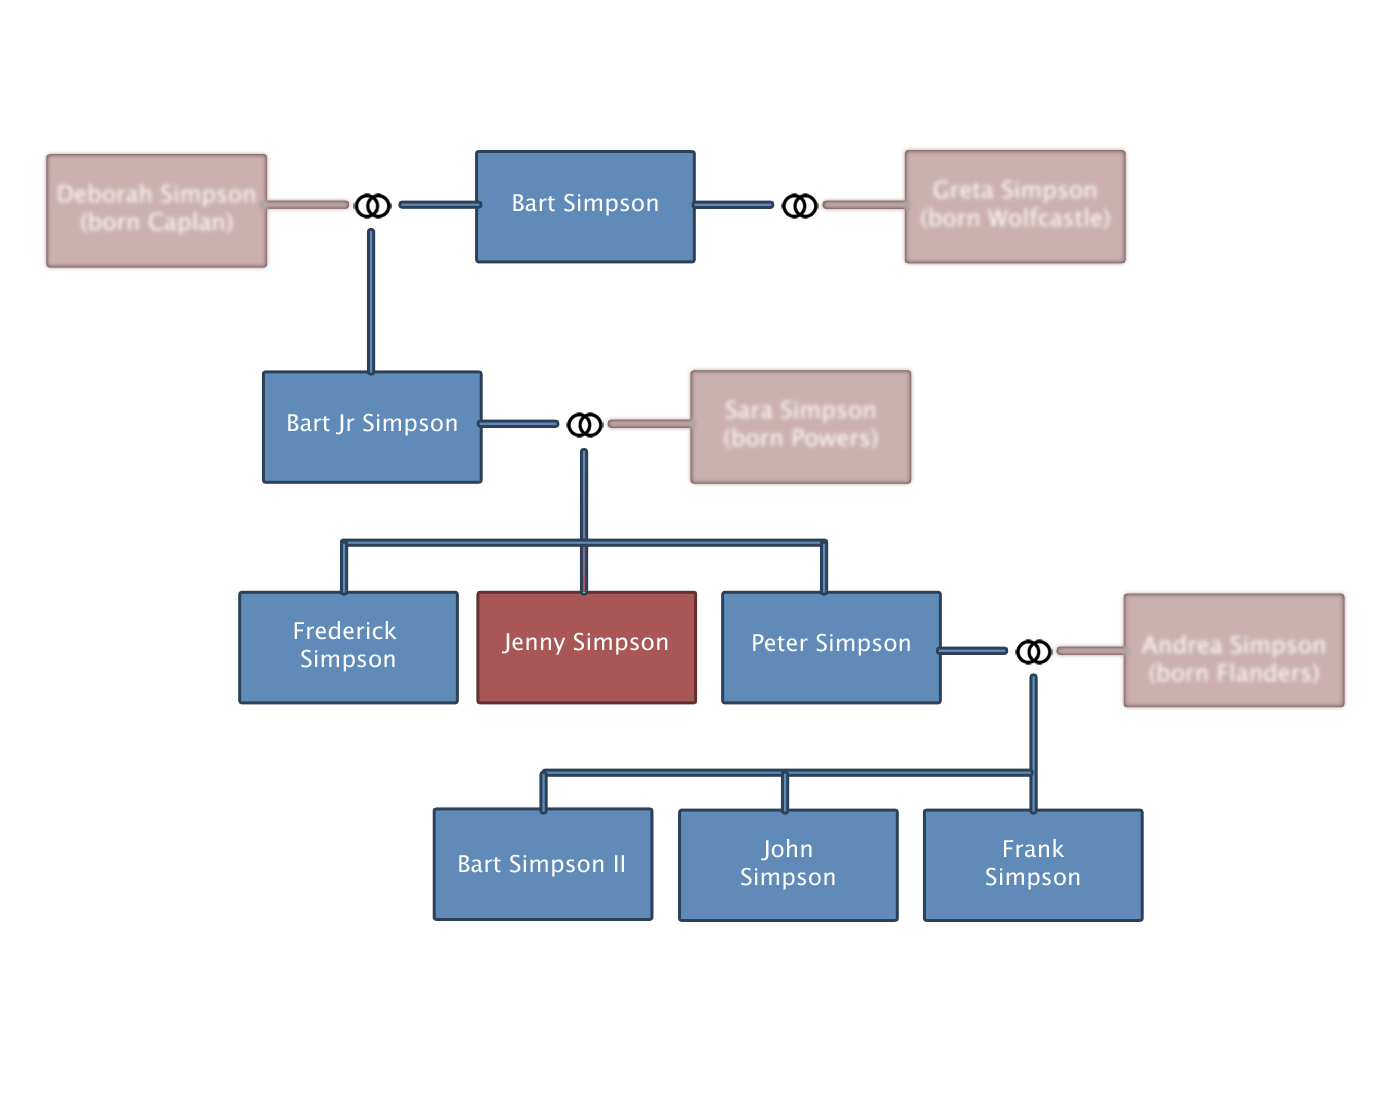
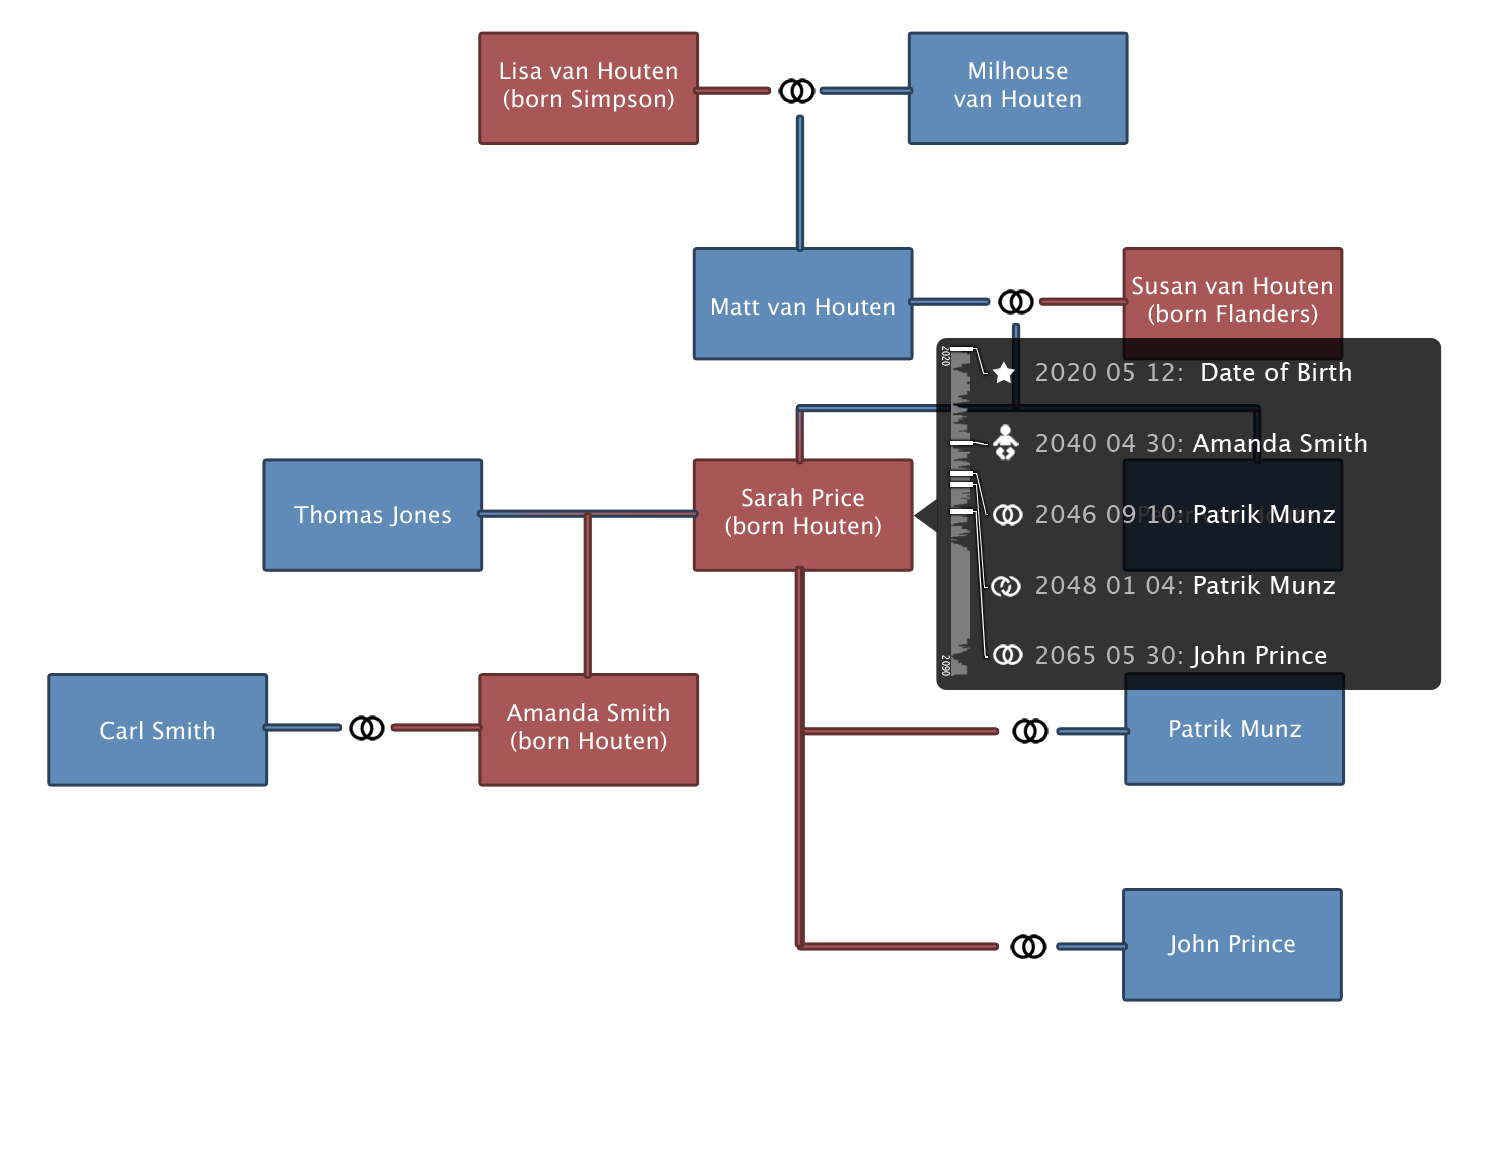
Additionally it is possible to switch to or open a traditional tree view as an additional navigation view or simply for familiarities sake.
Visual Mapping
| Variable | Visual attribute |
|---|---|
| Person attributes | |
| Name | Text |
| Details | Text (when interactively invoked) |
| Gender | Color of timeline |
| Date of birth | Begin position of timeline |
| Date of death | End position of timeline |
| Lifespan | Length of timeline |
| Satisfaction level | Height of bar |
| Event attributes | |
| Event type | Icon |
| Relational event | Icon and vertical line (e.g. implies parent child relation) |
| Event Details | Text (when interactively invoked) |
Applied Techniques
Non-interactive Techniques
- Time-lines [Aigner, 2009a] representing the personal history of a person.
- Hierarchical trees [Aigner, 2009b] implied by relational events.
- Symbols [Miksch, 2009a] for the recognition of major event types.
- Bar charts representing the satisfaction level of a person dependent on time.
Interactive Techniques
- Zooming and panning [Aigner, 2009c] enabling the user to view the data at a higher resolution.
- Details on demand [Aigner, 2009d] enable the user to display detailed information about a data case.
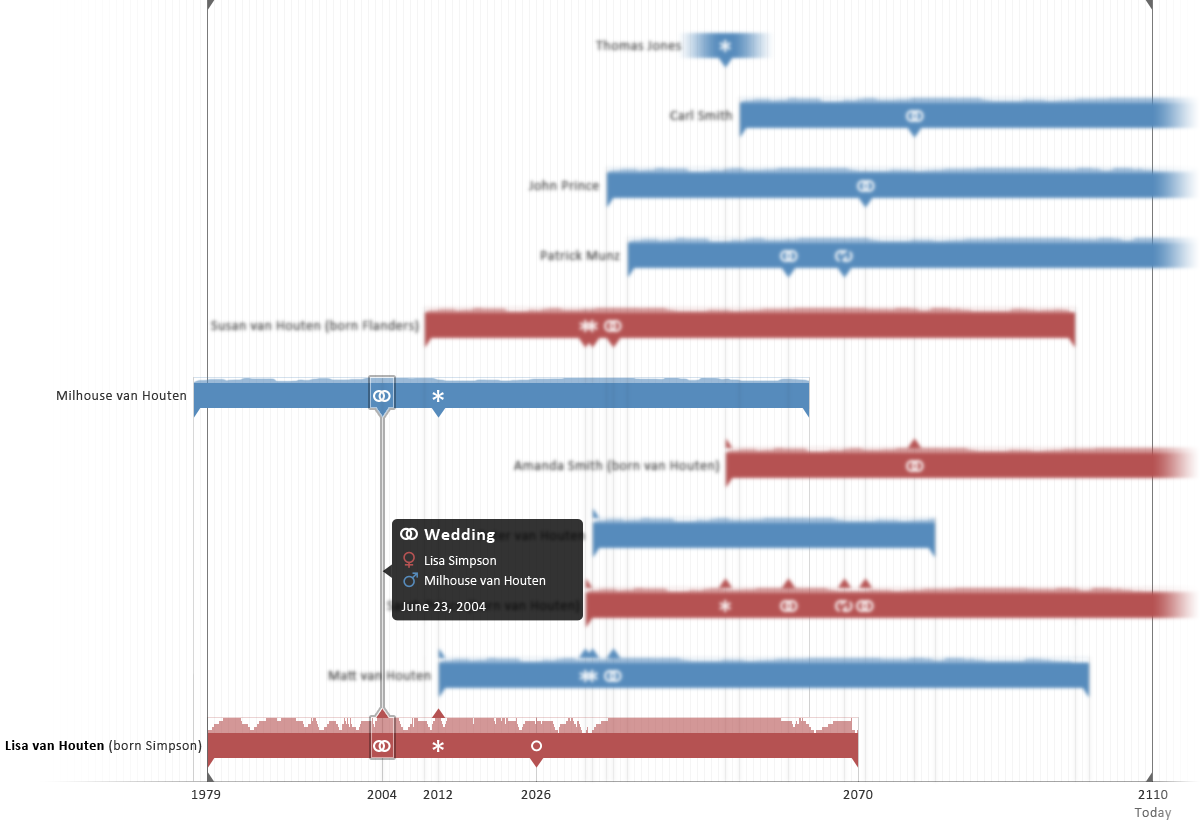
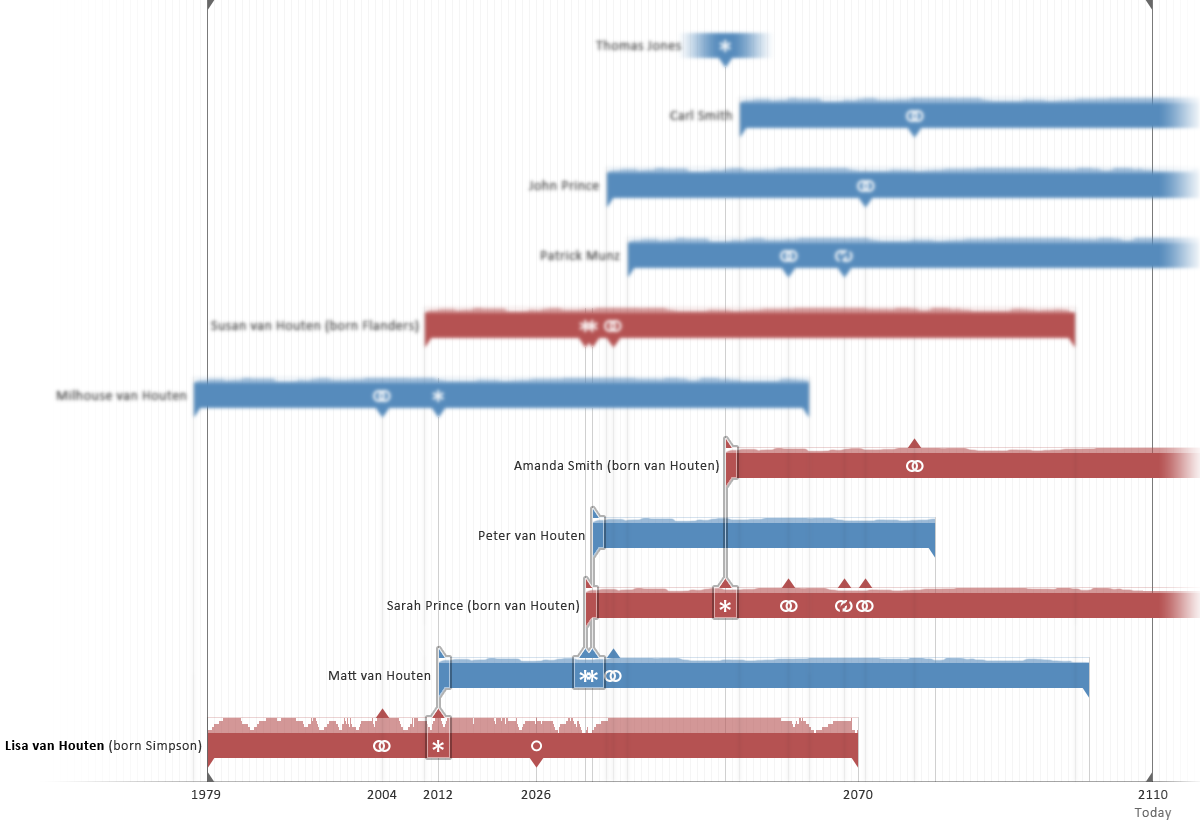
- Semantic depth of field [Miksch, 2009b] for the highlighting of time-lines and events on demand.
- Filter options [Aigner, 2009e] to show the user only the data he or she's interested in.
Interactivity
| Interaction | Purpose |
|---|---|
| Mouse over timeline | Shows detailed information about the respective person |
| Mouse out timeline | Hides detailed information about the respective person |
| Mouse over event | Shows detailed information about the respective event |
| Mouse out event | Hides detailed information about the respective event |
| Click on timeline | Highlights the person, aligns the birthday of the respective person to the jump mark, enlarges the satisfaction bar chart, highlights the consanguinity path. |
| Click on event | Shows detailed information about the respective event |
| Click on relational event | Applies a semantic depth of field on the related persons and the respective event |
| Clicking somewhere else | Deselects selected persons or events |
| Drag and drop timeline | Allows to manually sort a timeline vertically |
| Filter | Allows the selection of relevant data (e.g. certain names, event types, etc.) |
| Sort | Allows the (vertical) sorting of the time-lines (e.g. after name, birthday, etc.) |
| Compare | Displays an additional canvas for an additional tree |
| Scrubber | Configurable to show certain details at its current position in the timeline. (e.g. Satisfaction level as shown in the comparison mockup) |
The interactive features above should be regarded as the default behaviour of the visualization. A settings dialog where the users can change this behaviour is conceivable.
Mockups
Timeline View
Tree View
Features
The main view of the visualization is relatively clutter-less since only essential information is shown. The user has nevertheless the possibility to filter the data according to his personal relevance and to improve the visual appeal of the visualization by manually sorting the time-lines vertically. The visualization furthermore assist the user to keep focus by applying techniques such as semantic depth of field and highlighting.
Advantages
- Implicit and well known representation of temporal data
- Simple representation of hierarchical data
- Precise display of satisfaction levels
- Avoidance of visual clutter by features such as details on demand and filters
- Relatively easy to comprehend
Possible Improvements and Extensions
- The possibility to attach media files to persons or events to offer an additional depth of information (e.g. photos, video clips, documents, etc.).
- The possibility to display global events and periods (such as depressions, climate changes, pandemics, etc.) to offer more insights.
References
- [Aigner, 2009a] Wolfgang Aigner. Visualization of Time-Oriented Data: Visualization Techniques. Created at: December 15, 2009. Retrieved at: January 4, 2010. http://www.ifs.tuwien.ac.at/~silvia/wien/vu-infovis/PDF-Files/20091214_timevis_techniques_1up.pdf. pages 33-36.
- [Aigner, 2009b] Wolfgang Aigner. Hierarchical Techniques. Created at: November 30, 2009. Retrieved at: January 4, 2010. http://www.ifs.tuwien.ac.at/~silvia/wien/vu-infovis/PDF-Files/20091130_hierarchical-techniques_1up.pdf. pages 16-17.
- [Miksch, 2009a] Silvia Miksch. Icon-based Techniques. Created at: November 9, 2009. Retrieved at: January 4, 2010. http://www.ifs.tuwien.ac.at/~silvia/wien/vu-infovis/PDF-Files/InfoVis-3.1up.pdf. page 8.
- [Miksch, 2009b] Silvia Miksch. Focus+Context & Distortion Techniques. Created at: November 24, 2009. Retrieved at: January 4, 2010. http://www.ifs.tuwien.ac.at/~silvia/wien/vu-infovis/PDF-Files/InfoVis-5_1up.pdf. page 84-110.
- [Aigner, 2009c] Wolfgang Aigner. Interaction and Visual Analytics. Created at: December 10, 2009. Retrieved at: January 4, 2010. http://www.ifs.tuwien.ac.at/~silvia/wien/vu-infovis/PDF-Files/20091210_interaction-va_1up.pdf. page 28.
- [Aigner, 2009d] Wolfgang Aigner. Interaction and Visual Analytics. Created at: December 10, 2009. Retrieved at: January 4, 2010. http://www.ifs.tuwien.ac.at/~silvia/wien/vu-infovis/PDF-Files/20091210_interaction-va_1up.pdf. page 37.
- [Aigner, 2009e] Wolfgang Aigner. Interaction and Visual Analytics. Created at: December 10, 2009. Retrieved at: January 4, 2010. http://www.ifs.tuwien.ac.at/~silvia/wien/vu-infovis/PDF-Files/20091210_interaction-va_1up.pdf. pages 38-47.
