Teaching:TUW - UE InfoVis WS 2009/10 - Gruppe 11 - Aufgabe 4
Aufgabenstellung
Zu erstellende Visualisierung
- Stammbaum der Nachkommen von Lisa und Bart Simpson*
...Visualisierung der Nachkommen von Lisa Simpson sowie der Nachkommen von Bart Simpson. Dabei sollen zwei Stammbäume entstehen - einer von Bart und einer von Lisa - die dann miteinander verglichen werden können. Zuerst kommen Lisa und Bart, dann deren Kinder, ihre Enkel, etc. (mind 4 Generationen). Da es noch keine Nachkommen gibt, können diese frei erfunden werden.
Die Visualisierung soll folgende Informationen darstellen:
- Verwandtschaftsverhältnisse (zumindest Eltern-Kinder),
- Unterscheidung zwischen Blutsverwandtschaft und angeheirateten Familienmitgliedern,
- Geburts- und Todestag sowie Lebensdauer von allen Familienmitgliedern,
- wichtige Ereignisse im Leben jedes Familienmitglieds (z.B., Anzeigen, Gefängnisaufenthalte, Schulzeit, Studienzeit, Nobelpreise, Arbeitslosigkeit etc.)
- Zufriedenheit jedes Familienmitglieds (Skala: sehr niedrig - niedrig - mittel - hoch - sehr hoch); kann sich im Laufe des Lebens ändern.
Die Visualisierung soll die interaktive Auseinandersetzung mit den Daten ermöglichen. Verpflichtend: Möglichkeiten zum besseren Vergleich von einzelnen Abschnitten der Stammbäume bzw. Vergleich von Ausschnitten aus Lisas und Barts Stammbäumen. + mind. 2 weitere Interaktionsmöglichkeiten (z.B., Details on Demand, Filteroptionen)
Allgemein:
- Die Daten sollen zur Analyse von Zusammenhängen zwischen Familienverhältnissen, wichtigen Ereignissen und Zufriedenheit visualisiert werden (die Anwendungsgebiets- und Zielgruppenanalyse kann kurz gehalten werden).
- Die bisher erlernten Design-Prinzipien sollen umgesetzt werden z.B.: Optimierung der Data-ink ratio (keine Comics!), visuelle Attribute (Größe, Farbe, Position, etc.) sollen sinnvoll eingesetzt werden (Information darstellen).
- Die Mockups sollten zumindest 1) die beiden Stammbäume im Überblick und 2) eine detaillierte Vergleichsansicht von 2 Teil-Stammbäumen wiedergeben.
- Alle nicht angeführten Daten können frei erfunden werden.
Links
a) Description of application area, data, target group & tasks
1. Application area and given dataset
1.1 Application area analysis
The originating graph shows relations of a family. Futhermore individual happenings and feelings are shown in the tree and the comparison of individual sections should be possible.
1.2 Data analysis
This Informations are shown in the family tree
- tree itself --> hierarchical structure
- name --> nomial data
- gender --> nominal data
- date of birth / date of death --> ordinal data
- life time --> ordinal data
- important events --> list of nomianal data
- satisfaction -->dirscrete data
2. Target group analysis
The target groups of this application are peoples who looking for informations of a given family. This can be a person who is interrested in the history of his family. The most used method to visualize family relations is a directed graph in which the progeny described by child nodes.
3. Aim of the visualization
the aim of this visualization is to display all informations of a family in an easy way. All given. All the given tasks (see declaration of this exercise) should be intuitionally available.
b) Concept
Information
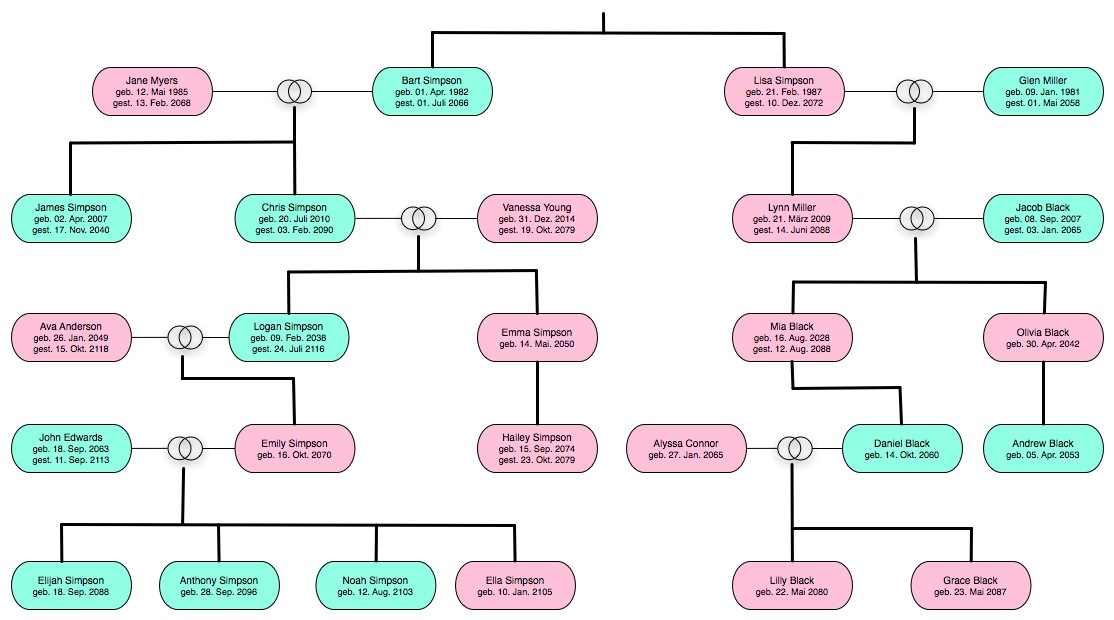
The following graphic shows the familiy tree from Bart and Lisa Simpson. On the top is the beginning with Bart and Lisa. Below you can find their childs, grandchilds, great-grandchilds and the childs of the great-grandchilds. Males are blue and females are pink characterised.
Family relationship
A thick line show the family relationship between parents and childs.
Difference between blood relationship and releated by mariage people
A thick line show the blood relationship and two overlapped circles show the related by mariage persons.
Date of birth and day of death
Both dates are shown in the family tree graphic under the names of the persons.
Age, happiness and important events in life (Details on Demand)
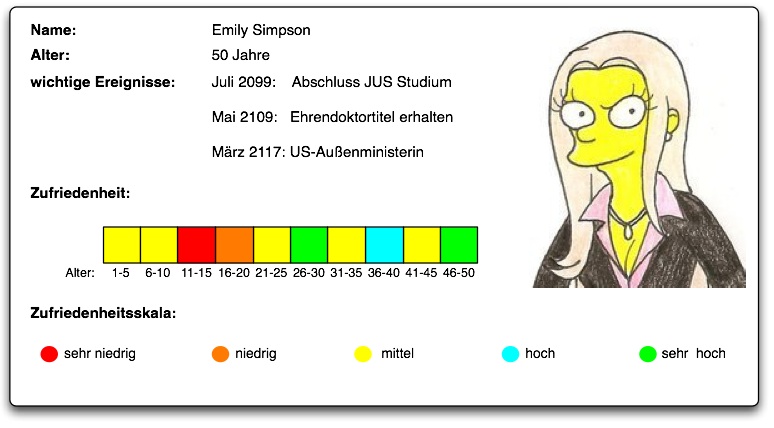
If you will know the age, happiness or the important events in life of a person you should double-klick on the specific box of this person.
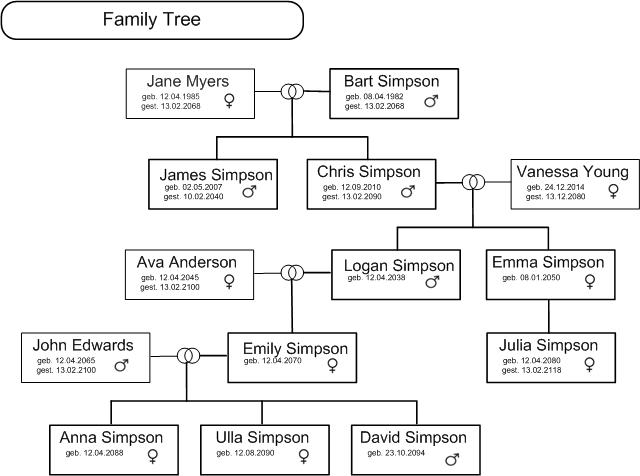
Family tree - Bart Simpson
by klicking a person you get details (children,wife,..)(colored red)
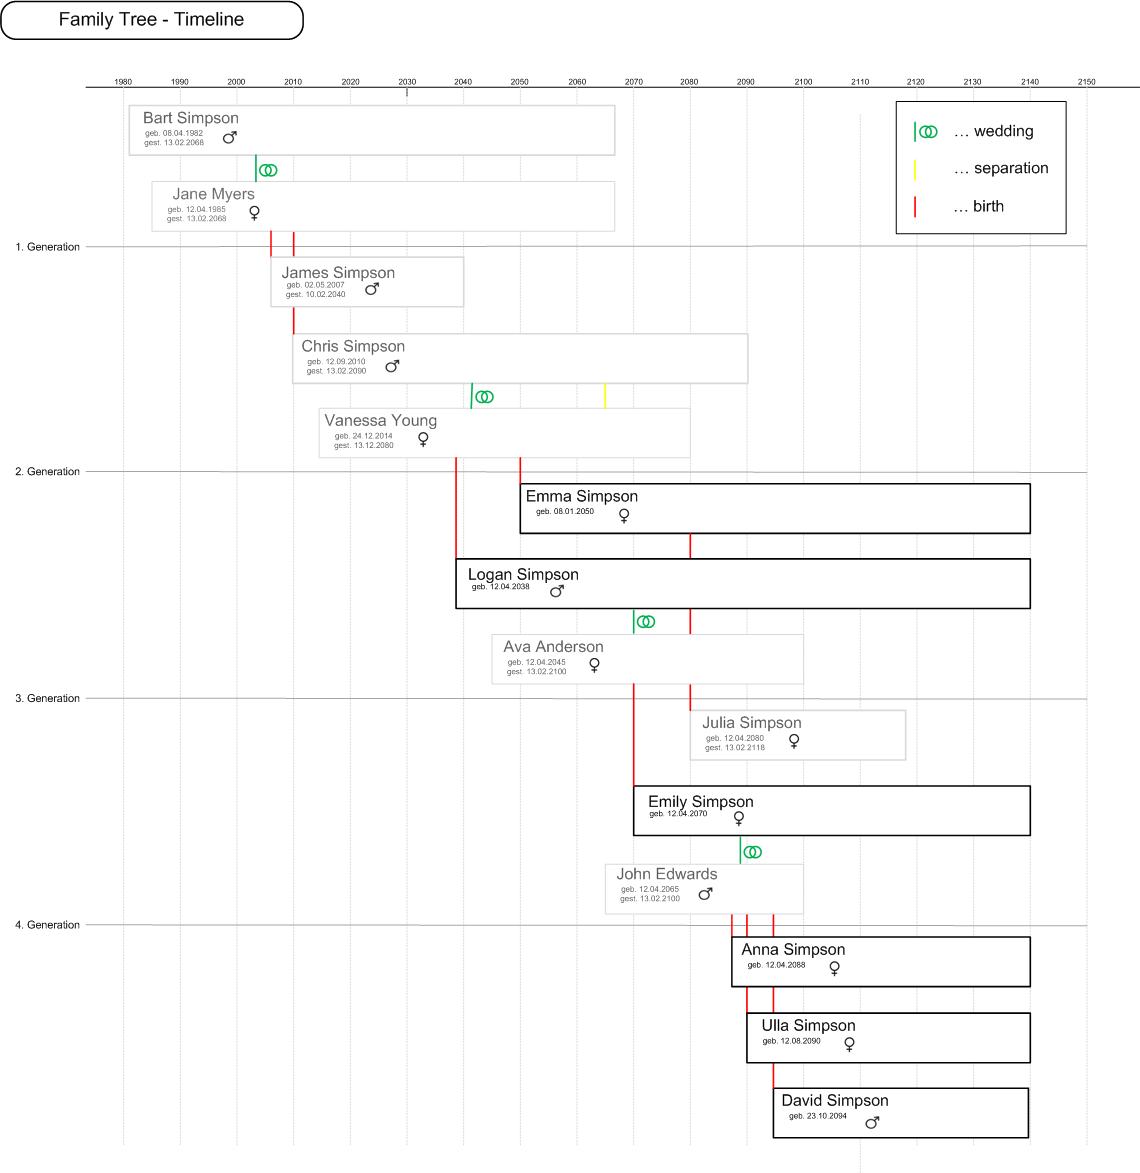
you can switch between the normal and the timeline view. In the timeline view you can see important events e.g wedding, separation, birth. For more detailed information double-klick on the person(Details on Demand). Dead people are grayed out and the day of death is shown in the box.
Family tree from Bart and Lisa Simpson (comparison)
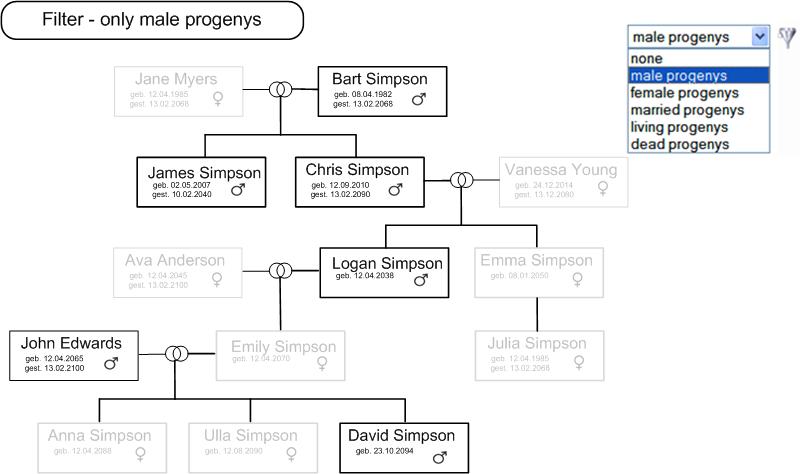
Filteroptions
There are various filter options:
- only show married progenys
- only show living/dead progenys
- only married progenys
