Teaching:TUW - UE InfoVis WS 2009/10 - Gruppe 10 - Aufgabe 4
Aufgabenstellung
[http://ieg.ifs.tuwien.ac.at/~gschwand/teaching/infovis_ue_ws09/infovis_ue_aufgabe4.html Beschreibung der Aufgabe
4]
Zu erstellende Visualisierung
- Stammbaum der Nachkommen von Lisa und Bart Simpson*
...Visualisierung der Nachkommen von Lisa Simpson sowie der Nachkommen von Bart Simpson. Dabei sollen zwei
Stammbäume entstehen - einer von Bart und einer von Lisa - die dann miteinander verglichen werden können. Zuerst
kommen Lisa und Bart, dann deren Kinder, ihre Enkel, etc. (mind 4 Generationen). Da es noch keine Nachkommen
gibt, können diese frei erfunden werden.
Die Visualisierung soll folgende Informationen darstellen:
- Verwandtschaftsverhältnisse (zumindest Eltern-Kinder),
- Unterscheidung zwischen Blutsverwandtschaft und angeheirateten Familienmitgliedern,
- Geburts- und Todestag sowie Lebensdauer von allen Familienmitgliedern,
- wichtige Ereignisse im Leben jedes Familienmitglieds (z.B., Anzeigen, Gefängnisaufenthalte, Schulzeit,
Studienzeit, Nobelpreise, Arbeitslosigkeit etc.)
- Zufriedenheit jedes Familienmitglieds (Skala: sehr niedrig - niedrig - mittel - hoch - sehr hoch); kann sich
im Laufe des Lebens ändern.
Die Visualisierung soll die interaktive Auseinandersetzung mit den Daten ermöglichen. Verpflichtend: Möglichkeiten zum besseren Vergleich von einzelnen Abschnitten der Stammbäume bzw. Vergleich von Ausschnitten aus
Lisas und Barts Stammbäumen. + mind. 2 weitere Interaktionsmöglichkeiten (z.B., Details on Demand, Filteroptionen)
Allgemein:
- Die Daten sollen zur Analyse von Zusammenhängen zwischen Familienverhältnissen, wichtigen Ereignissen und
Zufriedenheit visualisiert werden (die Anwendungsgebiets- und Zielgruppenanalyse kann kurz gehalten werden).
- Die bisher erlernten Design-Prinzipien sollen umgesetzt werden z.B.: Optimierung der Data-ink ratio (keine
Comics!), visuelle Attribute (Größe, Farbe, Position, etc.) sollen sinnvoll eingesetzt werden (Information
darstellen).
- Die Mockups sollten zumindest 1) die beiden Stammbäume im Überblick und 2) eine detaillierte Vergleichsansicht
von 2 Teil-Stammbäumen wiedergeben.
- Alle nicht angeführten Daten können frei erfunden werden.
Description of application area, data, target group and tasks
Application area and data
A family tree views the genealogy of a person. It is utilized by an individual for seeking information about
relatives of various generations. According to the application area of the family tree different details of
personal information might be of special interest. For lords the purity of the blood line is the reason to draw a
family tree, for youth of today it is rather hobbies and interests of a person.
The given data set contains a group of people with detailed information about their lives. Every person is
defined by its name, ancestors, descendants and further personal data such as birth date, education, etc. The
data can be classified as follows:
- Id: discrete
- Name: nominal
- Dates: ordinal
- Gender: binary
- Additional information: nominal
Visualizing the data properly results in a family tree, which is an ordinate graph showing a hierarchical
structure. Each family member is represented by a node in the tree linking with their ancestors and descendants.
This characteristic implies that the data set has an explicit hierarchy.
Target group
Family Trees are usually drawn for people who are interested in their roots. One of the first found fields of
application in history was Jesus’ family tree in the changed manner of listing the members of his genealogy.
Christians where able to allocate Jesus to well known families. [genWiki] Nowadays this remains not the only
purpose. A lot of families split, move and form new families. According to the interests of a target group a
visualization method should view different levels of details and kinds of information.
The typical user of the following concept is an adolescent asking herself where she comes from and if her
interests might correlate with any of her ancestors‘. Did someone in her family study the same profession or work
in a similar field? Was someone also arrested or did somebody win a special award? Since genealogy has been of
interest for centuries, there are dozens of kinds of visualizations for family trees existent. Some of their
symbols are in common use, other vary according to their field. Lines in shape of ‘u‘ or a ‘=‘ often symbolize a
marriage, while circles and triangles represent genders.[Stre87] In the described target group a certain level of
detail is of interest, thus another aspect of the data has to be viewable.
Aim
This visualization is designed not only to seek family members, but to give detailed Information about ancestors.
The user should be able to compare different family members as well as sections of the tree. Additionally
personal data can be retrieved and also put into comparison. User friendly navigation on the timeline supports
the lookup of ancestors. A general overview of the entire family tree gives a general idea of the family
structure, while the zoomed in mode allows to receiving a certain level of detail. Where do I come from? Does my family have a criminal history? Are there certain trends of profession? Who was
happy in my family? What did they do in their lives? Where are the location based roots of my family?
Concept
- Types of Visualization <br\> Three different Views are visualized. The timeline view is a bar chart that shows the live durance for each person ordered by birth date. As induced by the name the tree view is visualized by a directed graph. Furthermore there is a frame to show the portrait for the chosen person.
- Visual Mapping<br\>
Timeline:
- Age -> Length of a person’s bar (size) in relation to the other bars;
- Contentment -> Color of the bar, the happier the person the lighter the green;
- Relatives by blood -> Relatives by blood are marked with a red stroke
- Years -> Years are mapped to intervals on the timeline
- Gender -> A circle with an arrow attached identifies a man, while a cross with a circle on the top identifies a woman
- Marriage -> A ‘]’ indicates that two persons are married
- Children -> If there is only one Child a simple line is used to link with the parents, in case of two or more children this symbol ‘[‘ is used
- Relatives by blood -> Relatives by blood are induced by the color of the gender symbolization
- Interaction<br\>
- Zooming on the Timeline -> With the little square on the top right corner of the view frame (light green) the user may adjust the timeline to the frame of interest. By zooming in, the level of detail of the visualized years can be augmented (bars get larger).
- Selection: Click on a person’s bar (timeline) or symbol (tree view) -> By clicking on a bar the portrait of this person will appear in the Frame next to the Graph.
- Double click on bar or symbol -> Per double click the main windows changes its views from timeline to tree view or vice versa. For the clicked person one generation of descendant and according to the zoom factor as much ancestors as the window provides space for.
- Filtering -> Entering a word in the search field will filter the family tree. Only thus containing the given criteria will remain in the view. Clicking on the filter symbol more than one criterion can be selected
- Mockups<br\>
Timeline view showing comparison with different zoom factors<br\>
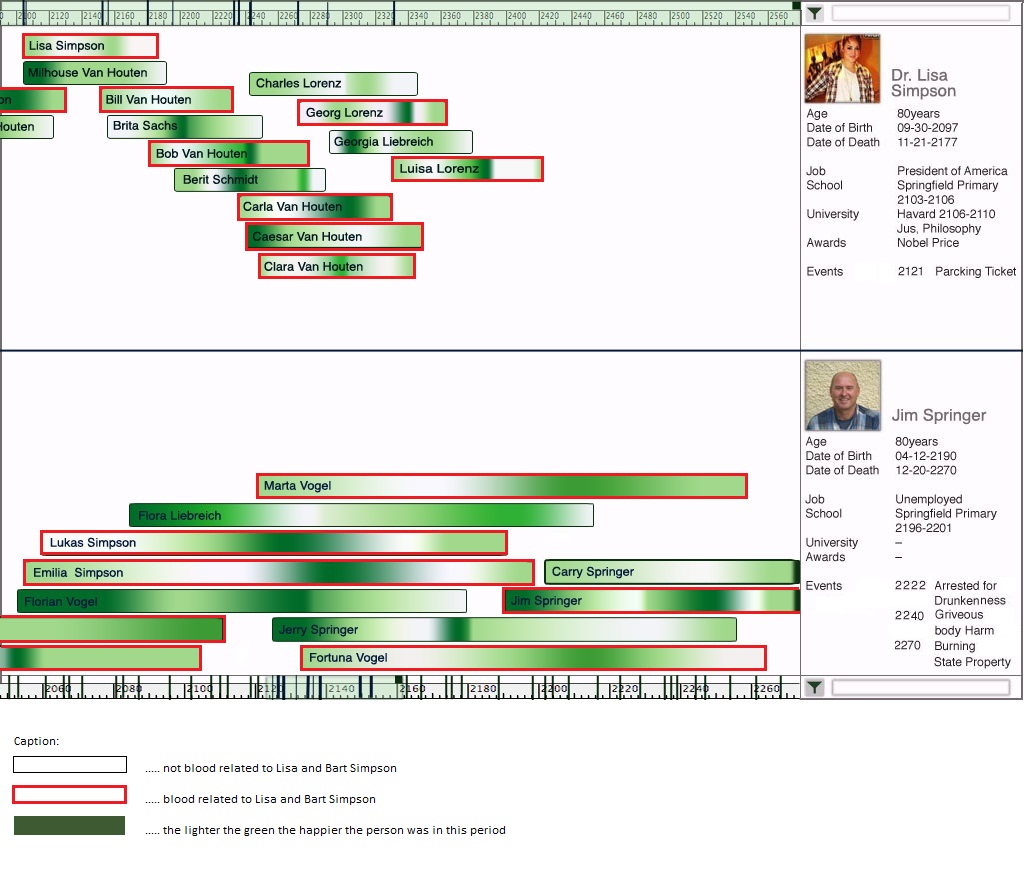 <br\>
<br\>
Tree view comparing the family trees of Bart and Lisa <br\>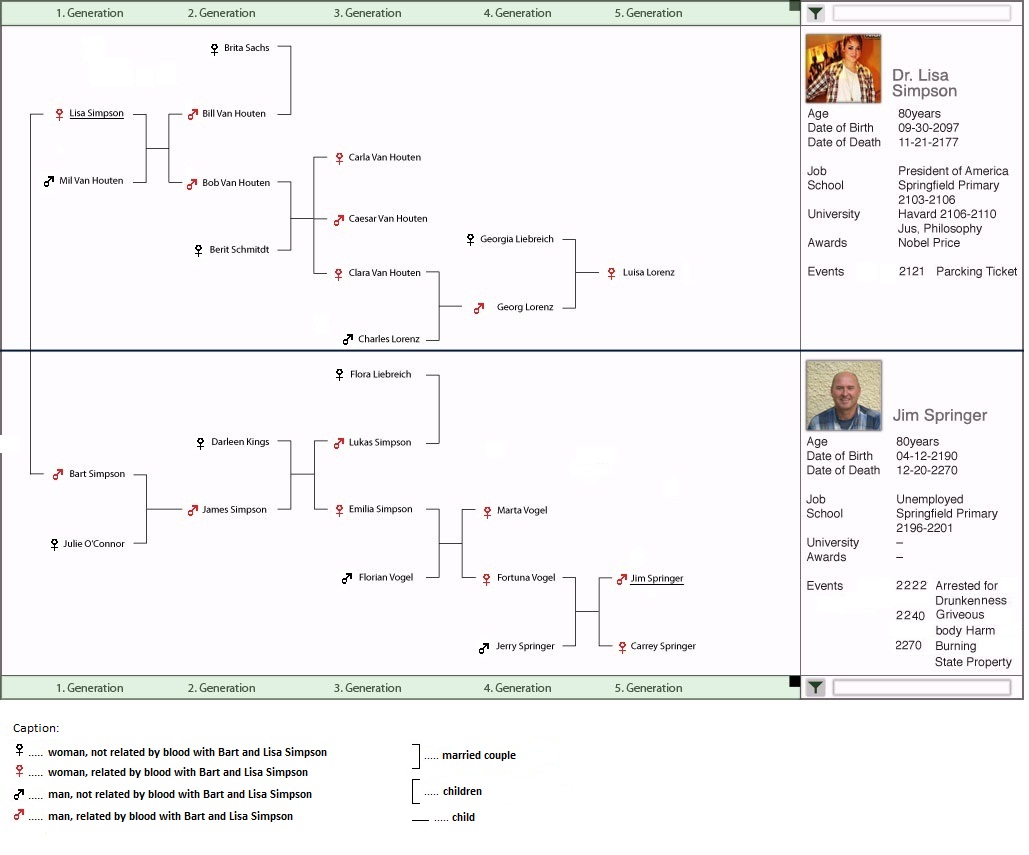 <br\><br\>
- Usability and Characteristics<br\> Filtering is as simple as entering a word. The system will filter all data by the criterion. Furthermore the tree view will be rendered from the ego perspective chosen and show a four generation of the tree. The zooming panel eases the navigation trough the data, which is especially useful in big data sets. Not everybody might feel familiar with the handling of two different views to choose from. Since the portrait frame is not the biggest a scroll bar will appear once the data exceeds the frame size.
- Enhancement<br\> Integration of Geneological Data Communication (GEDCOM) file format [Chur99]; A function to invite family member via e-mail;


Bibliography
[genWiki] http://wiki-de.genealogy.net/Stammbaum#_note-2, last viewed Jan 7. 2010 <br\>
[Stre87] Bernhard Streck et al, Wörterbuch der Ethnologie, DuMont, Köln 1987, Page 238<br\>
[Aign09] Aigner Wolfgang, Hierachische Techniken, 30.11.2009
[Aign09] Aigner Wolfgang, Visual Analytics and Interactions, 10.12.1009<br\>
[Chur99] The Church of Jesus Christ of Latter-day Saints, The Gedcom Standard, Draft Release 55.1, Oct. 2
1999<br\>