Teaching:TUW - UE InfoVis WS 2009/10 - Gruppe 02 - Aufgabe 4
Aufgabenstellung
Zu erstellende Visualisierung
- Stammbaum der Nachkommen von Lisa und Bart Simpson*
...Visualisierung der Nachkommen von Lisa Simpson sowie der Nachkommen von Bart Simpson. Dabei sollen zwei Stammbäume entstehen - einer von Bart und einer von Lisa - die dann miteinander verglichen werden können. Zuerst kommen Lisa und Bart, dann deren Kinder, ihre Enkel, etc. (mind 4 Generationen). Da es noch keine Nachkommen gibt, können diese frei erfunden werden.
Die Visualisierung soll folgende Informationen darstellen:
- Verwandtschaftsverhältnisse (zumindest Eltern-Kinder),
- Unterscheidung zwischen Blutsverwandtschaft und angeheirateten Familienmitgliedern,
- Geburts- und Todestag sowie Lebensdauer von allen Familienmitgliedern,
- wichtige Ereignisse im Leben jedes Familienmitglieds (z.B., Anzeigen, Gefängnisaufenthalte, Schulzeit, Studienzeit, Nobelpreise, Arbeitslosigkeit etc.)
- Zufriedenheit jedes Familienmitglieds (Skala: sehr niedrig - niedrig - mittel - hoch - sehr hoch); kann sich im Laufe des Lebens ändern.
Die Visualisierung soll die interaktive Auseinandersetzung mit den Daten ermöglichen. Verpflichtend: Möglichkeiten zum besseren Vergleich von einzelnen Abschnitten der Stammbäume bzw. Vergleich von Ausschnitten aus Lisas und Barts Stammbäumen. + mind. 2 weitere Interaktionsmöglichkeiten (z.B., Details on Demand, Filteroptionen)
Allgemein:
- Die Daten sollen zur Analyse von Zusammenhängen zwischen Familienverhältnissen, wichtigen Ereignissen und Zufriedenheit visualisiert werden (die Anwendungsgebiets- und Zielgruppenanalyse kann kurz gehalten werden).
- Die bisher erlernten Design-Prinzipien sollen umgesetzt werden z.B.: Optimierung der Data-ink ratio (keine Comics!), visuelle Attribute (Größe, Farbe, Position, etc.) sollen sinnvoll eingesetzt werden (Information darstellen).
- Die Mockups sollten zumindest 1) die beiden Stammbäume im Überblick und 2) eine detaillierte Vergleichsansicht von 2 Teil-Stammbäumen wiedergeben.
- Alle nicht angeführten Daten können frei erfunden werden.
Purpose of the Visualization
Visual representations and interaction techniques take advantage of the human eye’s broad bandwidth pathway into the mind to allow users to see, explore, and understand large amounts of information at once. Information visualization focused on the creation of approaches for conveying abstract information in intuitive ways.[James J. Thomas and Kristin A,2005]
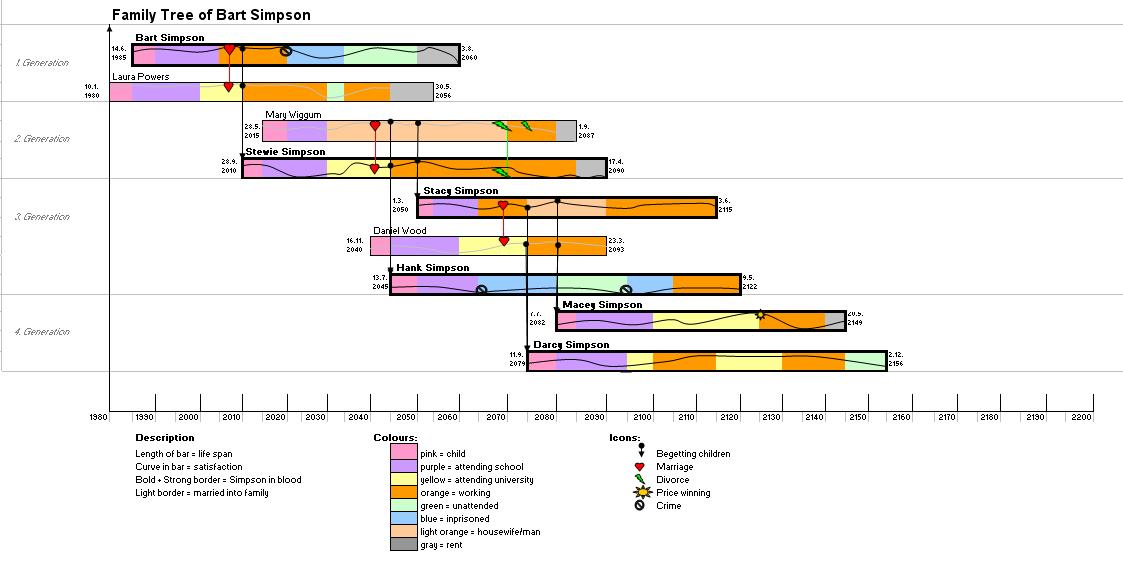
The Family Tree visualization makes it possible for the user to observe the life bar of a person with showing the special events (e.g. birth- and death-date, marriage, divorce, price winning, etc). It is capable to display the generations in a family, the relations between them and the different periods of one's life. It would be more clear when a time axes is added to show when exactly an event did happen. The visualization should be on one hand as simple as possible, on the other hand as functional and interacted as is needed.
Solution
Overview & Comparison on the family trees
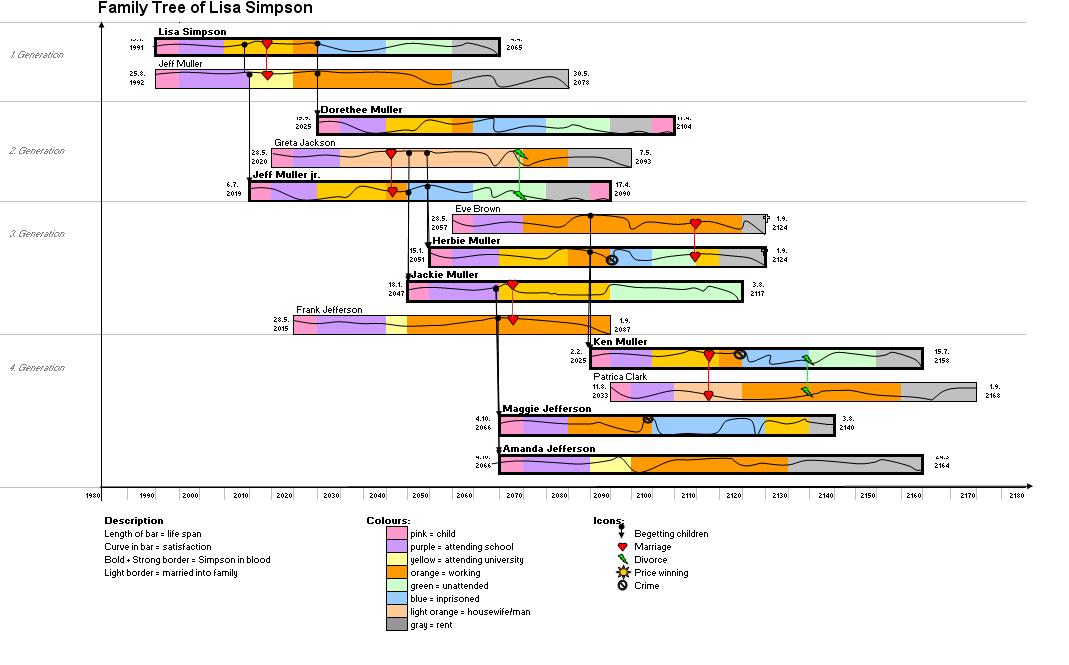
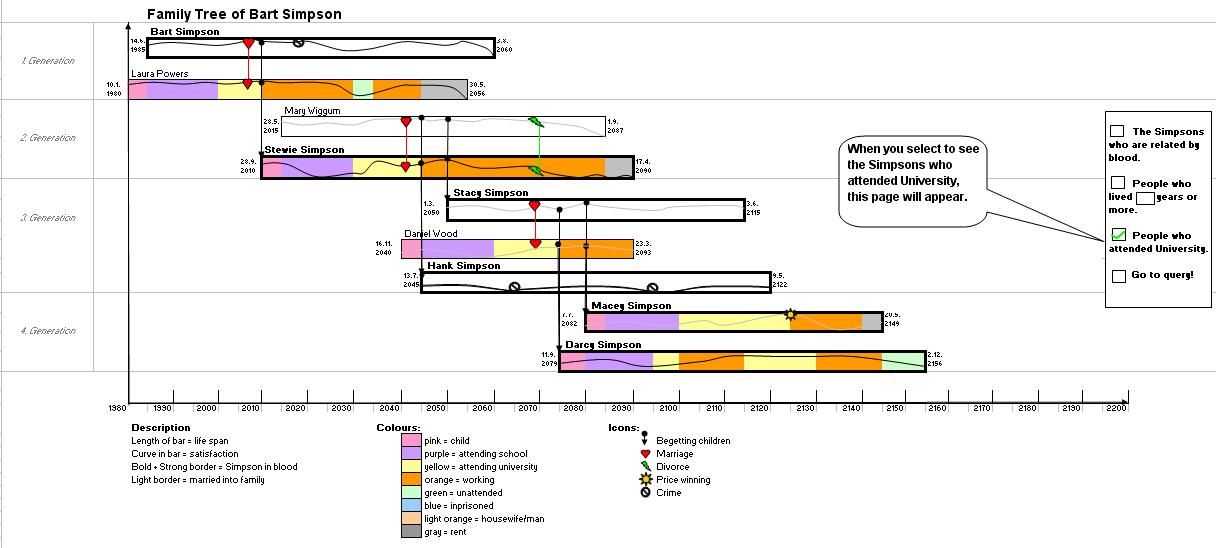
- The family tree is integrated in a coordinate system, where the x-axes stands for the time line, the y-axes defines the number of the generations.
- Each person is symbolized through a bar. The bar starts with the birthday of this person and ends with its death.
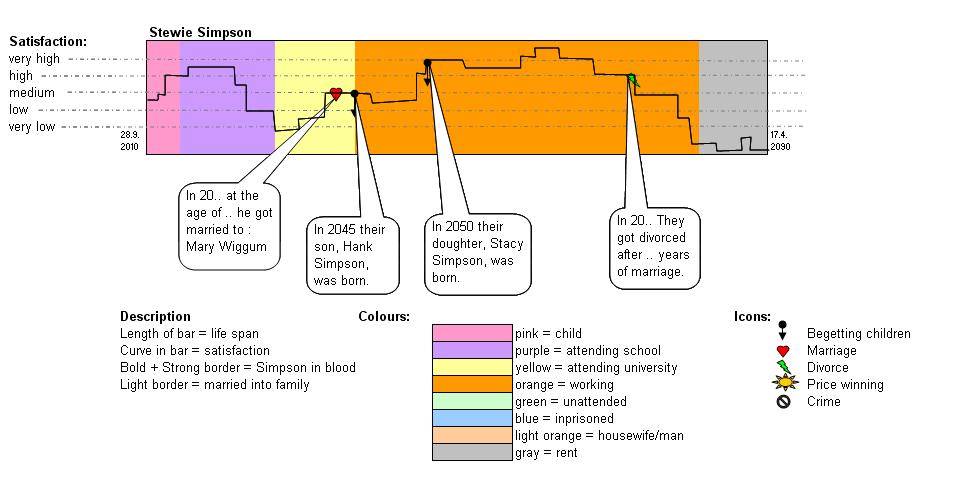
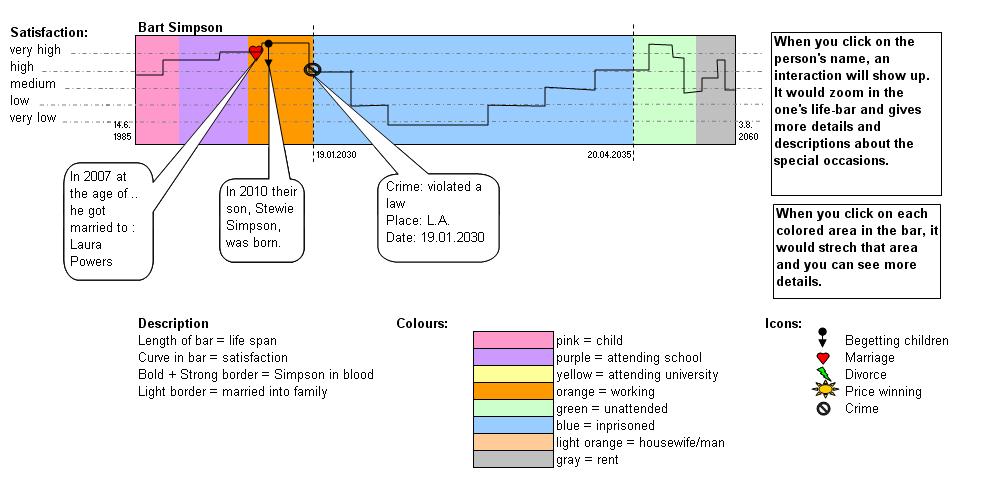
- The colours in the bars are used to symbolize time spans. Events that took place over a longer time period are marked with different colours. Their meaning is given in the description beneath the graph
- Inside each bar the satisfaction of the person is shown with the help of a curve.
- Events that happened at a specific time are represented through various icons. Those icons are directly located on the satisfaction curve, since they influence the satisfaction.
If an event included another person, those are connected through lines (e.g. marriage, children)
- Relation in blood - so the REAL Simpsons - are shown via bold borders of the bars. Everybody else, so the people that married into the family, have a light border.
- For a comparison with other family trees, the trees can be shown next to each other.
Interaction Mockups
The interactions that can be used for this type of visualization are:
- Details on demand:
By clicking on the bar of a specific person, a new window appears, that shows the information on this person more detailed. Here the satisfaction can be cleary distinguished into five states (very good - very poor), and the detailed dates and information of each event can be seen.
- Zoom and focus
After clicking on the timeline of a person, the timespans can be viewed in detail. E.g. Clicking on the blue timespan of Bart Simpson will extend this part of his life, while the other parts are shrinking in comparison. Like this, this part of his life can be analysed in detail.
- Filters
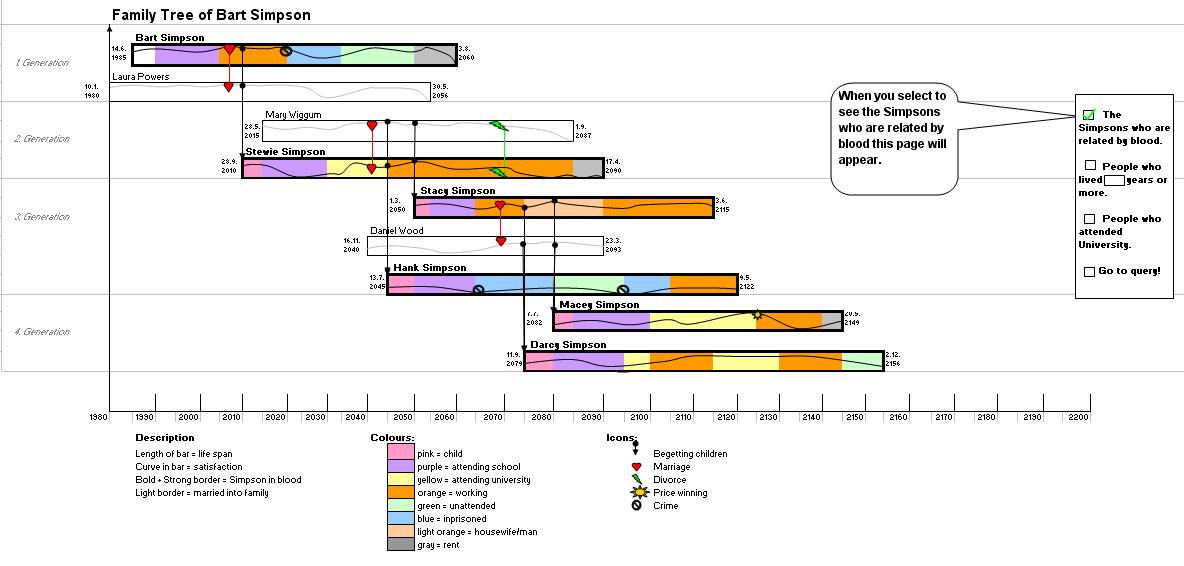
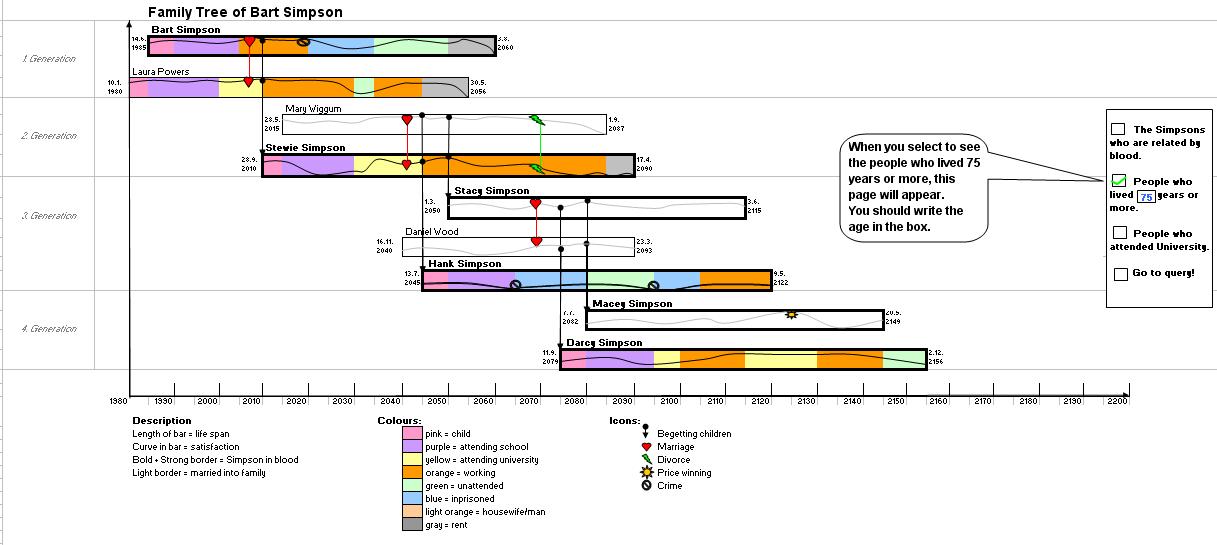
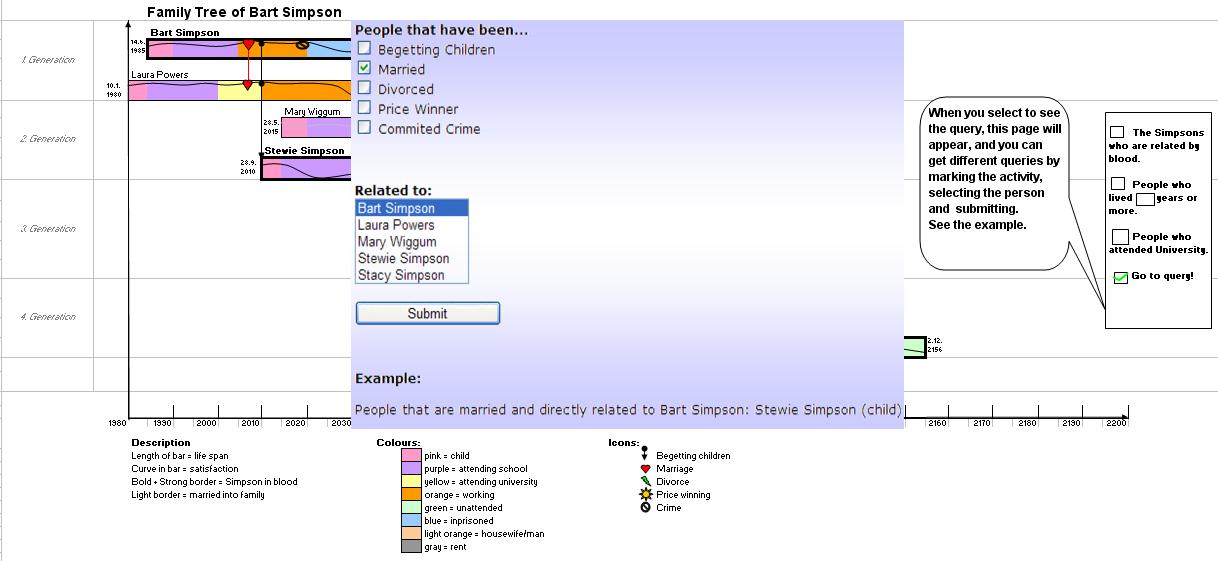
Since there is so many different information in this family tree, there has to be the possiblity of filters. Therefore we would integrate a form, where the user can choose that e.g. only married people, that are related to Bart Simpson, are shown. Those people will occur like before, but everybody else is only shown schematically, without any colours, so that the other people seem blurred.
- The folowing interactions can be retrieved:
- The Simpsons who are related by blood. This interaction will show the blood-related Simpsons in colors and others without colors.
- People who lived more than a specific years of age. They will show up in colors and others without colors.
- People who attended University. The people who attended university would show in colors.
- Query possibilities. By clicking on the "Go to Query" a window will apear and the user can get some queries. One can choose to see who are married, who are divorced, who has a child, who won a price and etc, together with who are related to a specific person.
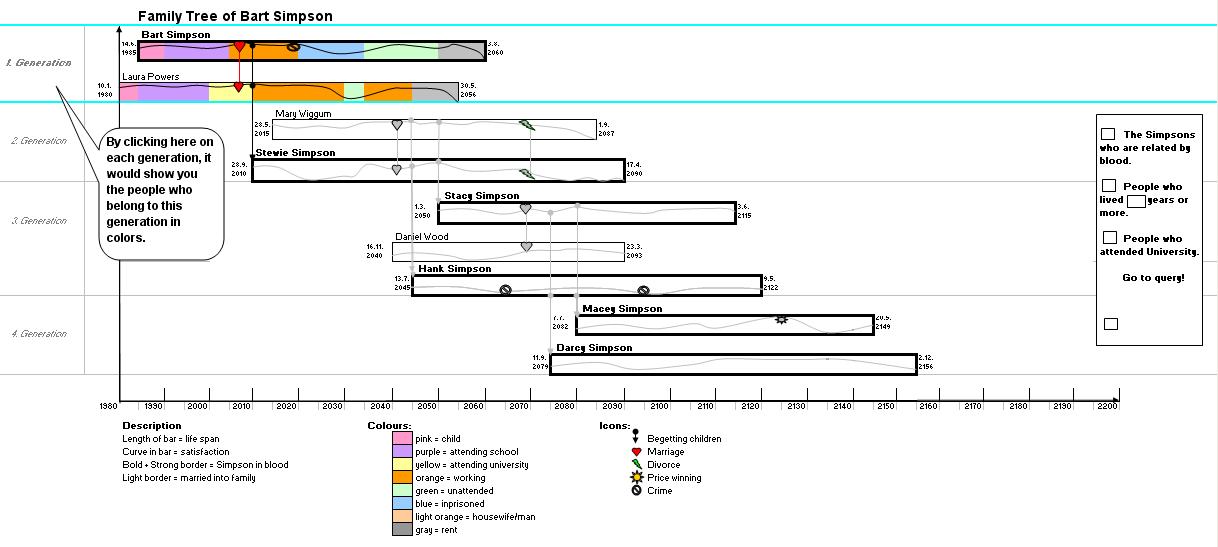
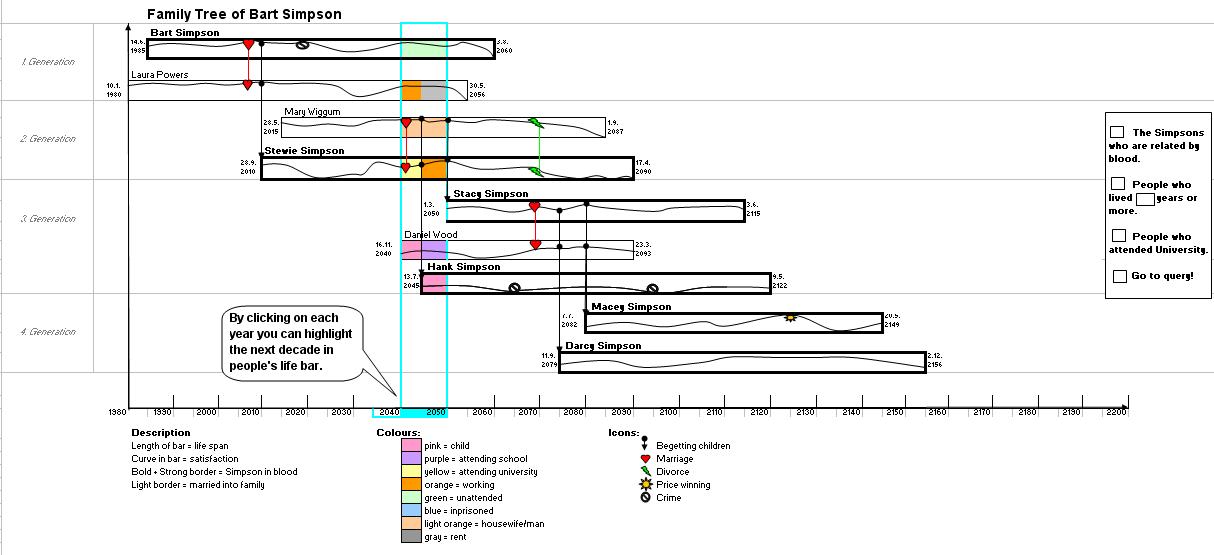
- Marking coordinate system. This would show the matching bars to a part of the x- or y-axes which is selected. By this interaction one can see the generations seperately, and also can observe what has happened in people's lives in a selected decade.
You could also use the coordinate system itself, while marking a part of the x- or y-axes, only the matching persons are shown, while the other are shown without colour.
References
- [James J. Thomas and Kristin A,2005] James J. Thomas and Kristin A. Cook (Ed.) (2005),National Visualization and Analytics Center. Last Modified: Friday, 22-Aug-2008, http://nvac.pnl.gov/agenda.stm
