Teaching:TUW - UE InfoVis WS 2008/09 - Gruppe 08 - Aufgabe 4
Aufgabenstellung
Gegebene Daten
Homer Simpson's Trinkverhalten in Abhängigkeit von seinen Lebensumständen
...Visualisierung von Homer's Lebensabschnitten bzw. Ereignissen mit Einfluss auf sein
Trinkverhalten (zB.: Kindheit, Pubertät, Arbeitslosigkeit, Beziehungen, Hochzeit, Geburt
der Kinder, Liebeskummer, Alltag, etc.) von seiner Geburt bis Jetzt + mögliche
Zukunftsszenarien (mind. 3).
- Die Menge folgender Getränke soll für die jeweiligen Lebensumstände ablesbar sein
(ml oder Liter - je nachdem - pro Tag, Monat, Jahr (z.B.: Fokus+Kontext Methoden):
 a) Wasser

 b) Milch

 c) Fruchtsaft

 d) Cola

 e) Kaffee (Würfelzucker?)

 f) Bier
(vereinfacht angenommen, Homer trinkt ausschließlich diese Getränke)
- Die folgenden Werte sollen abhängig von den konsumierten Getränken ablesbar sein:
 1) g oder kg konsumierter Zucker (aus Getränken) + empfohlene Maximaldosis pro Tag, Monat, Jahr
   (empfohlene Maximaldosis/Tag: 50g; enthaltener Zucker: 10g/100 ml Cola; 10g/100 ml Fruchtsaft; 3g/Würfelzucker).

 2) mg konsumiertes Coffein + empfohlene Maximaldosis pro Tag, Monat, Jahr
   (empfohlene Maximaldosis/Tag: 600mg; enthaltenes Coffein: 10 mg/100 ml Cola; 80 mg/100 ml Kaffee).

 3) g konsumierter Alkohol + empfohlene Maximaldosis pro Tag, Monat, Jahr
   (empfohlene Maximaldosis/Tag: 20g; enthaltener Alkohol: 3,6 g/100ml Bier)
- Die Daten sollen zur medizinischen/psychologischen Analyse visualisiert werden.
- Die bisher erlernten Design-Prinzipien sollen umgesetzt werden (z.B.: Optimierung der Data-ink ratio).
- Die Mockups sollten zumindest 1) Homer's Leben im Überblick 2) und eine Detailansicht wiedergeben.
- Alle nicht angeführten Daten können frei erfunden werden.
Analysis
- Field of application
The application is used to visualize medical blood count data of coffein, alcohol and sugar according to a discrete time in a persons life. It also displays the amount of consumed drinks. The amounts of the drinks are used to compute the consumed ingredients (sugar, alcohol and coffein).
- Target group
The target persons are doctors and patients. In general people who want an overview about their blood count in relation to their nutrition at a special time.
- Aims of the visualization
The main goal was to develop an easy to use application to get a well arranged visualisation. We also aimed a clear and beautiful design. The application is very simple to handle.
Concept
Visualization
- Mockup
- Tooltip
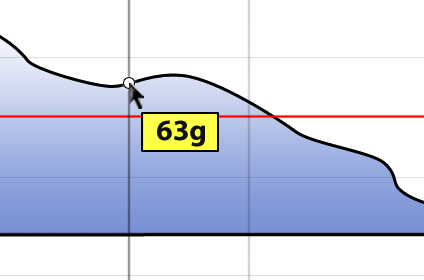
If you put the courser on the graph you get a detailed value of the bloodsample.

- Description
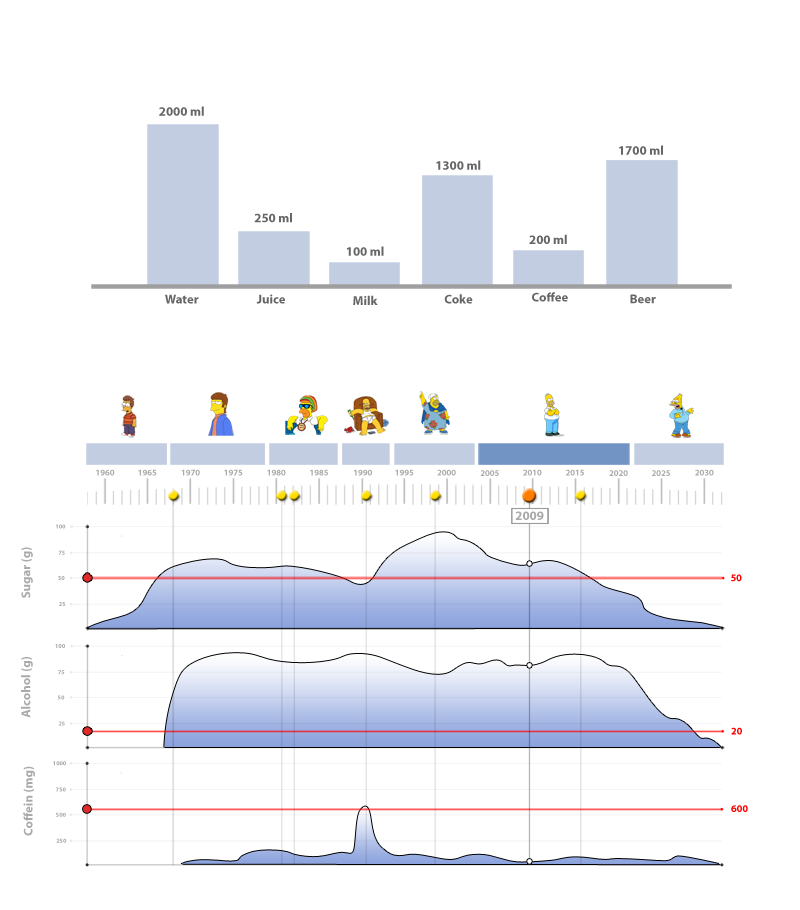
The bar chart displays the amount of the different drinks. There under are icons of homer simpson that are representing special stages in his life (from baby age to a ripe old age). If yout doubleclick one of homers special life stages you will zoom into this time and the timeline will change. Its minimum value will be the beginning of the selected stage and its end the end of the stage. You can also select a point between the discrete scales on the timeline. The selected date will be displayed beneath the orange dot wicht marks the selected position in the timline. The yellow dots represent special events in the persons life (marriage, first day at college and so on). To get detailed information on an event just click on the dot and a description of the event will be displayed beneath the dot. The graphs to display the blood count parameters are self explanatory. The red line marks the max dosis/day.
- Pros & Cons
The pros of the graph for the blood count are that you have an overview of the progress and not only 3 values for a selected time. The disatvantage is that you must downscale the scale to the min and max amount so you cannot read an exact value. This can be solved by displaying an exact value beneath the white dots on each graph, but we thought that this would lead to dispensable visualisation overhead. There is also the possibility to switch to a fisheye lense so that you get a closer look of the graph at positions that might be interessting.
