Teaching:TUW - UE InfoVis WS 2008/09 - Gruppe 08 - Aufgabe 1 - Contour Plot/Map
Jump to navigation
Jump to search
Definitions[edit]
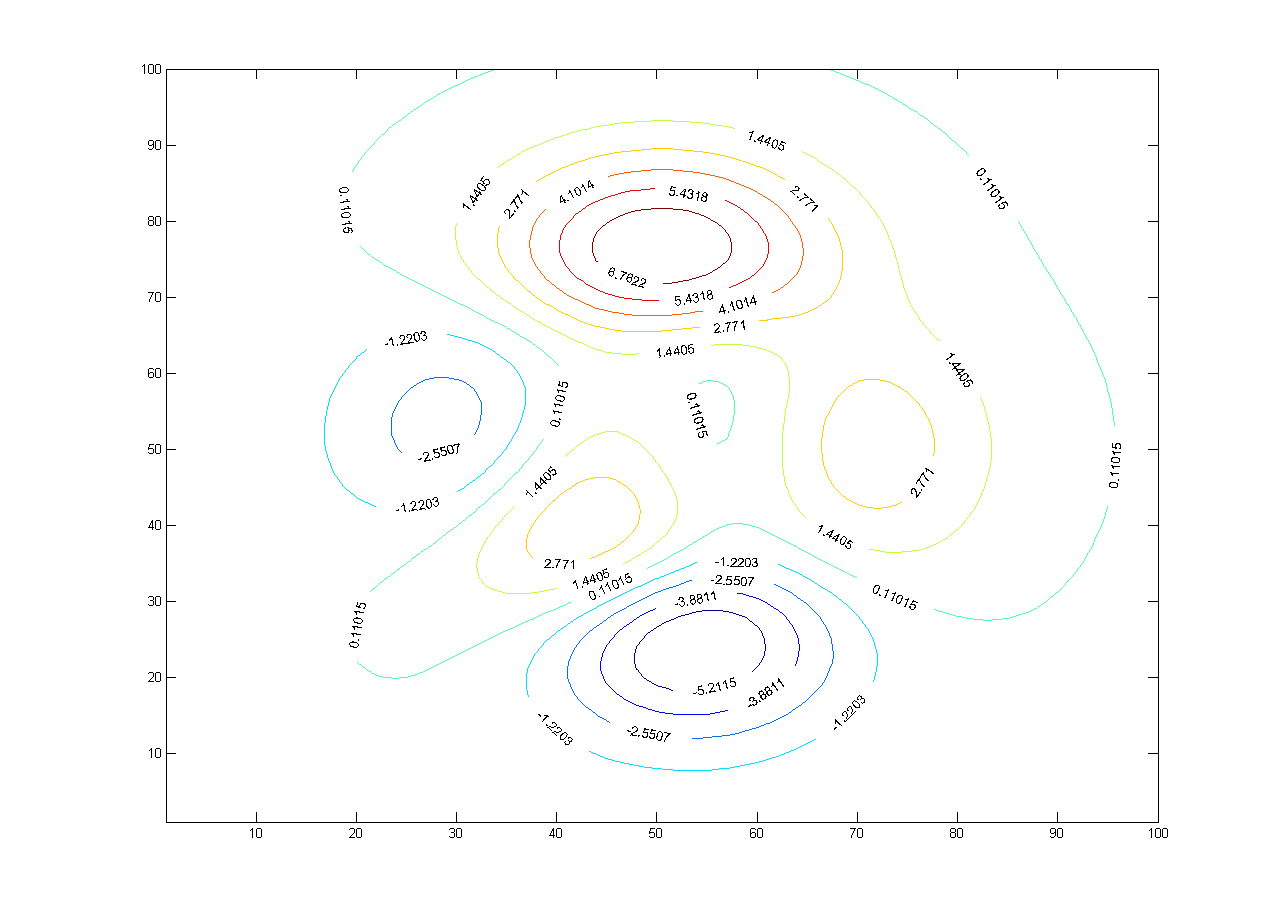
A contour plot (also contour map) is a graphic representation of the relationships among three numeric variables in two dimensions. Two variables are for X and Y axes, and a third variable Z is for contour levels. The contour levels are plotted as curves (also lines); the area between curves can be color coded to indicate interpolated values.
[SAS, 2008]
A contour line (also isoline) for a function of two variables is a curve connecting points where the function has a same particular value. ... The gradient of the function is always perpendicular to the contour lines. When the lines are close together the length of the gradient is large: the variation is steep. If adjacent contour lines are of the same line width, the direction of the gradient cannot be determined from the contour lines alone.
[AbAs, 2008]
Properties of contour lines[edit]

- Isolines have to be closed. They can only end at the map edge. Therefore they must be somewhere outside of the viewing area to connect itself, but then again they are closed.
- They may not touch nor cross nor run into each other. If there is no possibility to avoid this cause of reasons of scale or pressure, they should interrupt at such a bottleneck.
- The continuity of the values shown by the presence of isolines is in no way modified or restricted. A contour line never shows an edge, a step or a bend.
- The gap value depends on the distance from the isolines: The closer the isolines are the more rapid the continuum changes.
- Between any pair of points, whose imaginary line doesn't lie parallel to the neighboring isolines, there is a difference of the represented value, whether between the two points runs a contour line or not.
- At the same gap value, widely spaced points, between which no isoline runs, have a greater value difference than closely spaced points, between which a Contour line is located.
- The locations of the lines are actually random in the sense that they depend on the attributed values.
Applications[edit]


Data that can be displayed by a contour map is found in many applications. Any piecewise continuous, single-valued function of two continuous independent variables can be represented in the form of a contour map.
Meteorology[edit]
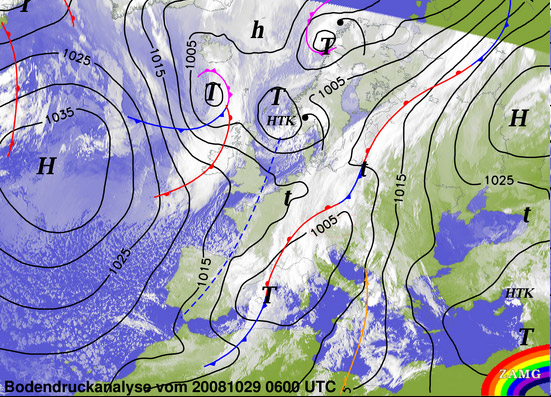
Numerous weather stations measure different meteorological properties. The collected data just represent the local situation at the weather stations. Therefore contour lines are drawn to best approximate the locations of exact values, based on the scattered information points available.
Isolines in meteorological maps:
- Barometric pressure (isobar)
- Temperature (isotherm)
- Precipitation and air moisture (isohyet and isohume)
- Wind speed and direction (isotach and isogon)
- Freeze and thaw (isotac)
Physical geography and oceanography[edit]
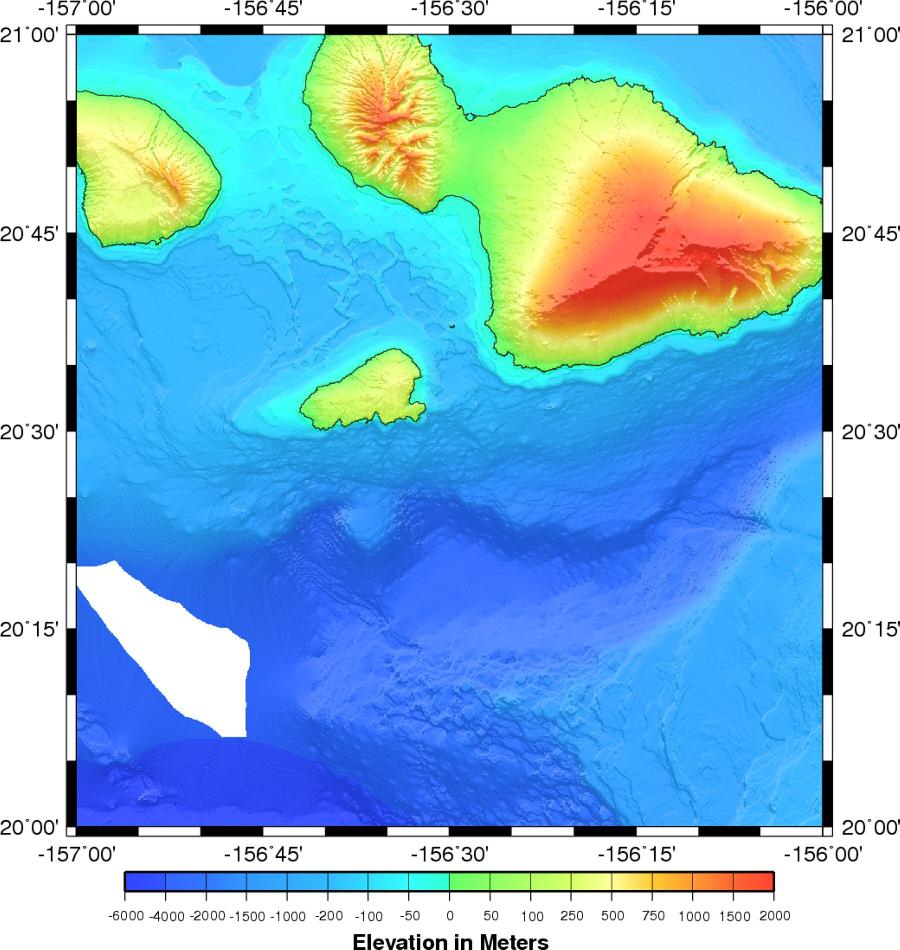
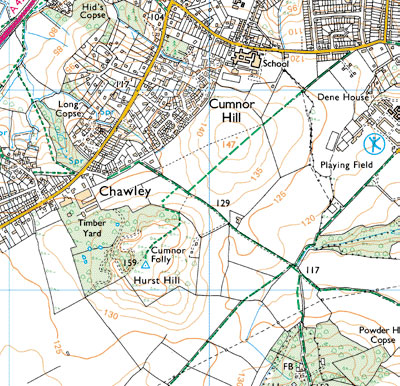
- Elevation and depth (topographic maps, bathymetric maps)
- Magnetism
- Oceanography
Environmental science[edit]
- Social sciences
- Thermodynamics, engineering, and other sciences
- Other phenomena
References[edit]
- [SAS, 2008] SAS, Contour Plot. SAS Online Doc. Retrieved at: October 29, 2008. http://support.sas.com/onlinedoc/913/getDoc/de/sgug.hlp/ctr_index.htm
- [AbAs, 2008] Absolute Astronomy contributors, Topographic map. Absolute Astronomy, Explore the Universe of Knowledge. Retrieved at: October 31, 2008. http://www.absoluteastronomy.com/topics/Topographic_map
- [Wakonigg, 2001] Herwig Wakonigg, Struktur und Wesen von Isolinienkarten. geoWEB (Institut für Geographie und Raumforschung). Created at: October 1, 2001. Retrieved at: November 6, 2008. http://www.uni-graz.at/geowww/geo/geoweb_magazin_artikel_detail.php?recordID=54
- [Morse, 1969] Stephen P. Morse. Concepts of Use in Contour Map Processing. Communications of the ACM, 12(3):147-152, March 1969
- [Wikipedia, 2008] Wikipedia contributors, Contour line. Wikipedia, the free encyclopedia. Retrieved at: October 30, 2008. http://en.wikipedia.org/wiki/Contour_map