Teaching:TUW - UE InfoVis WS 2008/09 - Gruppe 07 - Aufgabe 4
Aufgabenstellung
Gegebene Daten
Homer Simpson's Trinkverhalten in Abhängigkeit von seinen Lebensumständen
...Visualisierung von Homer's Lebensabschnitten bzw. Ereignissen mit Einfluss auf sein
Trinkverhalten (zB.: Kindheit, Pubertät, Arbeitslosigkeit, Beziehungen, Hochzeit, Geburt
der Kinder, Liebeskummer, Alltag, etc.) von seiner Geburt bis Jetzt + mögliche
Zukunftsszenarien (mind. 3).
- Die Menge folgender Getränke soll für die jeweiligen Lebensumstände ablesbar sein
(ml oder Liter - je nachdem - pro Tag, Monat, Jahr (z.B.: Fokus+Kontext Methoden):
 a) Wasser

 b) Milch

 c) Fruchtsaft

 d) Cola

 e) Kaffee (Würfelzucker?)

 f) Bier
(vereinfacht angenommen, Homer trinkt ausschließlich diese Getränke)
- Die folgenden Werte sollen abhängig von den konsumierten Getränken ablesbar sein:
 1) g oder kg konsumierter Zucker (aus Getränken) + empfohlene Maximaldosis pro Tag, Monat, Jahr
   (empfohlene Maximaldosis/Tag: 50g; enthaltener Zucker: 10g/100 ml Cola; 10g/100 ml Fruchtsaft; 3g/Würfelzucker).

 2) mg konsumiertes Coffein + empfohlene Maximaldosis pro Tag, Monat, Jahr
   (empfohlene Maximaldosis/Tag: 600mg; enthaltenes Coffein: 10 mg/100 ml Cola; 80 mg/100 ml Kaffee).

 3) g konsumierter Alkohol + empfohlene Maximaldosis pro Tag, Monat, Jahr
   (empfohlene Maximaldosis/Tag: 20g; enthaltener Alkohol: 3,6 g/100ml Bier)
- Die Daten sollen zur medizinischen/psychologischen Analyse visualisiert werden.
- Die bisher erlernten Design-Prinzipien sollen umgesetzt werden (z.B.: Optimierung der Data-ink ratio).
- Die Mockups sollten zumindest 1) Homer's Leben im Überblick 2) und eine Detailansicht wiedergeben.
- Alle nicht angeführten Daten können frei erfunden werden.
Interactiv visualization
Description of data, users and goals
Field of application and dataset
Our visualization will be used for medical data gathering and it should show a quick overview and detailed data of homer's life and how his life's circumstances change his drinking habbits. Furthermore it should give information about clinical facts and how homer should change his drinking habbits to get a better life.
We are using multidemnsioal metric data for the drinks consumed by homer for a day in a special month in a special year of his life. We distinguish between fluids (water, milk, juice, cola, café, and beer), contained substances (sugar, alcohol, caffeine), and their recommended maximum dose. "Homer's Life Circumstances" uses metric data for age, money, health, kids and hair. Married and employed are binary datas.
Target group
This application could be used by medical staff (psychologists, doctors ) and the patient, because our visualization is very simple so everybody is able to deal with the application but also contains all the sufficient data to make medical analysis possible. The ideal case would be if the doctor and his patient would go through the data our visualization offers.
The "Life Overview" in our visualization offers a quick look how drinking habbits have changed and so the doctor can have a quick look what has changed. If you need a closer look and maybe a psychologist wants to answer the question why homer's drinking behavior has changed, our visualization offers a zoom in function down to a single day, where you can see homer's life circumstances, the consumption of drinks and the amount of sugar,alcohol and caffeine someone should eat.
Aims of the visualization
Goals:
- The visualization should show the change in drinking habits of the named types of fluids (water, milk, fruit juice, coke, coffee and beer) and the amount of certain ingredients (sugar, caffeine, alcohol) ingested per time unit depending on displayed detail-level over time and the influence of certain events during the life of the subject.
- Demonstration of the maximum sugar, caffeine, alcohol a healthy person should consume and the actual amount homer consumes
- Easy derivation of things to change in homer's life to live a healthier life (change life circumstances to get back to healthier consumption of fluids)
Concept
Types of visualization

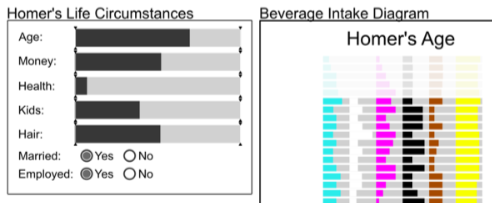
Different types of visualization were chosen in order to display the information. To get an overview of Homer Simpsons life one can see a distribution of the consumed drinks over the years. There is a possibility to enlarge certain parts of the diagram by "mouseover" it, which has a fisheye effect. The mouseover [Figure 1] effect also lets the exact values of the amounts of liquids pop up.
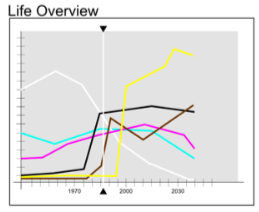
The intake of fluids over the year is not only displayed in the above mentioned way but also as a time-series [Figure 2] in order to amplify the impact of the data in question. That way the user can easily see the periode of time, in which the intake of e.g beer was high and milk was low.
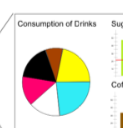
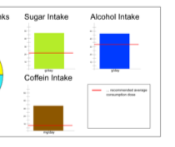
In order to get more details about one year, it is possible to click on the year to get a pie chart [Figure 3], which shows the distribution of the amount of different drinks in a more highlighted way. Next to the pie chart there is a bar chart [Figure 4] of the amount of consumed fluids compared to the amount of recommended maximum doses.
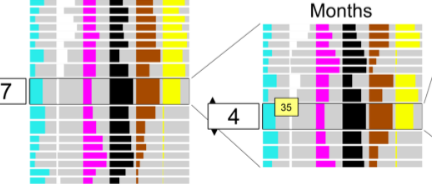
Double-clicking on one year will open a new distribution [Figure 5], next to the old one, showing Homers consumed drinks for each month. Also, clicking on one month will show a pie chart as well as a bar chart of consumed fluids and maximum recommended dose. In this view it is also possible to double-click on one month, which will open the distribution shown for each day with the same possibilities mentioned above.
Visual Mapping
The used data can be parted in different types of data with different dimensions. On the one hand there are the different years, all having the same shape and size, all ordered by date in reverse order.
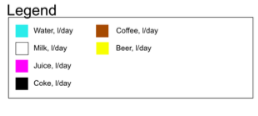
On the other hand there are different fluids, each having a different color [Figure 6] and changing sizes. Each "year-container" is filled with different amounts of each color, which display the dimension of the consumed drink for each year. The amount of each drink is also presented in a pie chart (for year, month and day) by the area it takes up.
Another type of data-dimensions used in the graphs is the comparison of the consumed amount of fluid and the recommended maximum dose. This comparison is displayed showing the dimension of fluid (in height) next to the dimension of maximum dose (in height).
Description of principals and techniques
Different types of representation were used to visualize Homer Simpsons drinking habits.
Distribution [Few, 2004]: shows the distribution of different values on either vertical or horizontal bars.
Bar chart: uses only vertical or horizontal bars to show different value in one or more messures and no particular order.
Time-Series [Few, 2004]: showing different types of data of the same measure on a timeline.
Pie Chart [Gruppe, 2008]: shows the distribution of different components which are parts of the whole.
Fisheye: used to enlarge certain parts of a chart in order to be able to get a better preview of the data
Click / Double-click / mouseover: as a technique to navigate through the chart different commands are used.
Interaction possibilities
For the user there are different types of interacting with the system. When seeing the overview of Homer Simpsons life they can "mousover" all parts of the chart to see the data enlarged. If they are interested in more detail of the data, one click will display a new diagramm showing the selected data not only in detail but also giving more background information to see (e.g. the comparison of consumed fluid to recommended fluid, current situation concerning childhood, study, marrige, amount of children...).
Even more detailed views can be seen when double-clicking on the selected year/month/day. This will open a view not unlike the first overview, only in a different measure (month instead of years, days instead of month). The user can again get an enlarged view just "mouseovering" the data and more details clicking it once.
The overview of the data (years/month/days, depending on the level the user is at) can still be seen on the left side of the new data. The chosen data is always framed, to show which detailed view is displayed at the moment, hence navigating back to get more detailed views on other sections of Homer Simpsons life is easily accomplished.
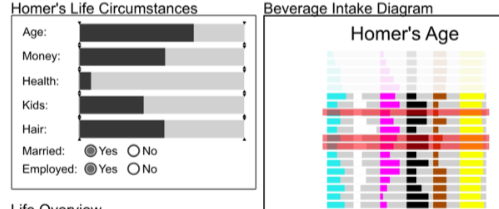
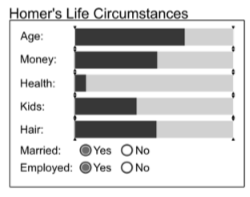
Another possibility to interact is the window which shows the current situation of the patient. This view displays data showing information about Homer Simpson from the currently selected periode of life, e.g. the amount of money he had available at this time, the amount of children he had and if he was married or not. This window can also be used as a selection tool in form of a dynamic query. The user is for example able to change the amount of children to go directly to the time, when Homer had 3, 2, 1 or 0 children. The selected years are then highlighted [Figure 7 + 8], so that the user can easily see the periode of time he or she selected.
The tool mentioned above can also be used as tool for prognosis [Figure 9]. The user can select a year in the future of the patient, change the circumstances of Homer Simpson (e.g the amount of money he might have in future, divorcing him...) through dragging the markers up or down and then see in the other window the prognosis.
The system does not use the exact values of the liquids on a regular basis, but if the user needs to know the exact values, the system can show them, by rotating the bars of the chosen data and showing the numbers [Figure 10].
Mockup(s) / Fake screenshot(s)
![Screenshot of the system [Gruppe 07, 2009]](/w/images/8/85/System.png) [Figure 11: Screenshot of the system [Gruppe 07,2009]]
[Figure 11: Screenshot of the system [Gruppe 07,2009]]

How does the system support the users in their tasks?
The system is designed to give the user a good overview of the patients life and habits. The possibility to have a look at not only an overview, but to easily get more detailed information about the circumstances the patient was in at what time and the change of drinking behavior can make future prognosis easier for the user. Not only the physical information can be taken into account but also the mental situation the patient was in at the moment.
Furthermore the user has the possibility to compare the drinking habits at different times using the "compare screen", which makes it easier to actually find out the exact differences.
The users have an easy way to look at prognosis of Homer Simpsons future drinking habits by using the prognosis tool and changing the information, hence can try to advise Homer Simpson in a more precise way.
Specialties
The system itself is pretty much self-explanatory. The navigation is simple and there is a lot of information displayed on one screen without being too detailed to get confused or too little detailed to be meaningless. The user can not only see disconnected data but has a lot of background information to go with it. Therefore making prognosis as well as psychological profiles becomes easier.
Advantages and disadvantages
Advantages: A big advantage is, as mentioned before, the easy navigation as well as the fact, that the user gets a good overview of the patients life. The unified use of colors for various liquids gives the user a chance to adapt to the system and hence the possibility to get an even better overview in less time when using the system on a regular basis.
Another major advantage is the prognosis/selection tool, which gives the user an possibility to select using a dynamic query as well as the possibility to foresee the patients drinking habit to a certain point.
Disadvantages: Due to the fact, that there is a huge amount of not only relevant data but also additional data used in the system, putting in the data as well as keeping it up to date takes up a rather big amount of time. Expanding the system to use more data might also turn out to be a bit complicated, because the new set of data might mean changes in the system architecture. This disadvantage can be avoided with the programmers keeping in mind that this can happen.
Future advancements
The more background information the user get the better. In the presented system the used data is pretty limited. The user learns a lot about Homer Simpsons drinking habits, so the intakes of various liquids which contain different amounts of sugar, caffeine and alcohol. Also interesting might for example be his eating habits, due to the fact that that might have a huge impact on his sugar balance.
References
- [Few, 2004] Stephen Few, Show Me the Numbers: Designing Tables and Graphs to Enlighten, Analytics Press, 2004, Appendix A - Table and Graph Design at a Glance.
- [Gruppe, 2008] Gruppe 7, Pie Chart, Infovis-Wiki,2008, http://www.infovis-wiki.net/index.php?title=Teaching:TUW_-_UE_InfoVis_WS_2008/09_-_Gruppe_07_-_Aufgabe_1_-_Pie_Chart