Teaching:TUW - UE InfoVis WS 2008/09 - Gruppe 03 - Aufgabe 1 - Cone Tree
Introduction[edit]

[VanWijk, 2008]
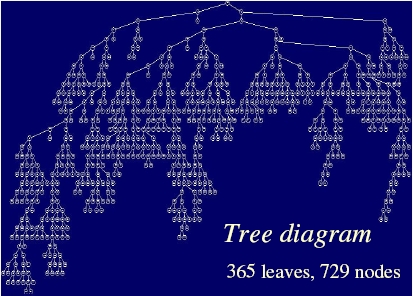
Cone Trees are a suitable visualization technique for dealing with a great amount of information in hierachichal structure, with the aim to display and navigate through the information in an intuitative manner. On screens a 2D layout of such structures wouldn't be easy to handle with. It would not fit on the screen and "The user would have to either scroll through the layout or use a size-reduced image of the structure."[Robertson et al., 1991]
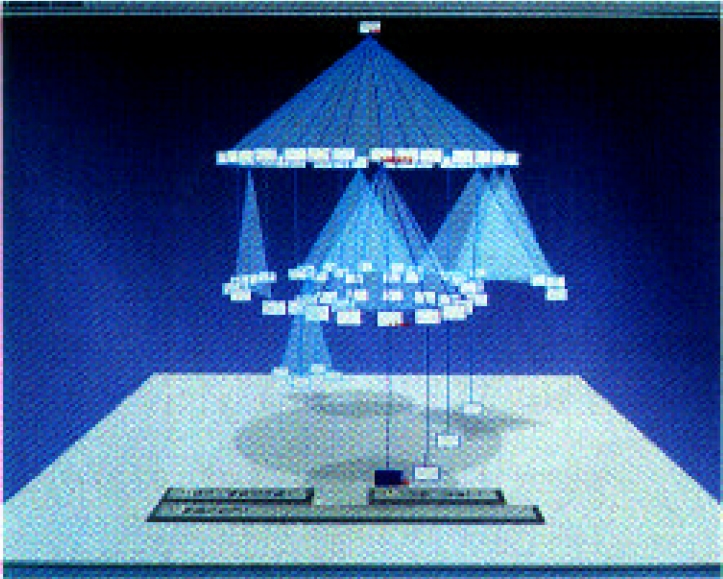
Instead of a 2D tree Cone Trees use three dimensional space. Therefore a parent node and its children are placed in that kind, so parent and children form a cone, with the parent at the apex and the children along the circular base of the cone.
Definition[edit]
Cone Trees represent hierachical data in a three dimensional way and allow fast navigation through these. Big amounts of data can be seen at once, thus the entire structure of a hierarchy is shown all at once. To view demanded data from this visualization method the cones spin around.
The idea in detail[edit]

[Robertson et al., 1991]
A Cone Tree is a three dimensional diagram with visible graphical edge from parents to their children (node-link diagram).
The root node is placed at the apex of the cone tree. All children nodes are placed at equal distances along the base. This process is repeated for every following level. Hence a child node may span further cones. The aspect ratio of the tree is fixed to fit the room, whereas each layer of cones has the same height.
A key idea is the possibility of interaction. For navigation the user can rotate the cone and choose a special node.
These rotations are shown the user with animations.

[Robertson et al., 1991]
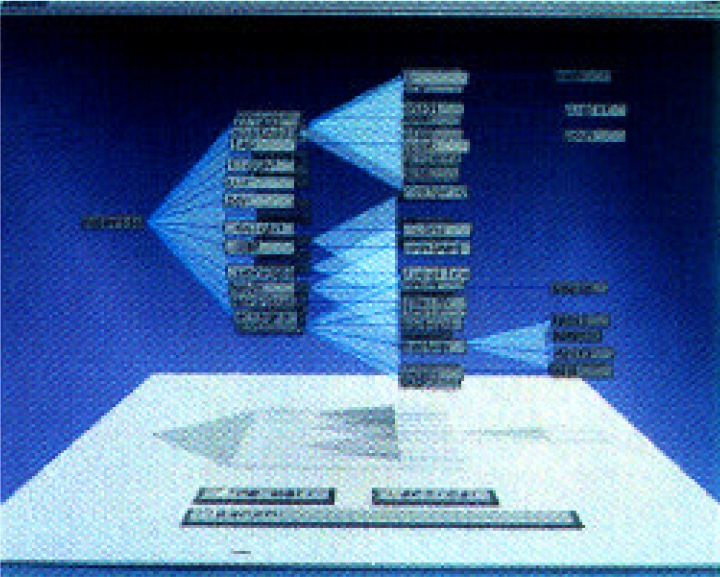
There is the possibility of an alternative horizontally layout, called the Cam Tree, which displays text for each node, compensating the problem of the other view, where text is only shown for the selected path.
The special behaviour and visualizing method of cone trees make them a perfect fit to display i.e. a UNIX file-system, a user interface supporting fulltext retrieval like LyberWorld and other interactive Search and Retrieval Interfaces like Cat-a-Cone.
Critics[edit]
A study showed that subjects were significantly slower at locating named files in a hierarchical data structure when using a cone tree interface than when using a 'normal' tree interface. [Cockburn and Mckenzie, 2000] And Cone Trees "seem to inherit a problem of standard node-link diagrams: they fall short when it comes to large trees. [Ying-Huey Fua] Visual clutters appear when showing more than 1000 nodes. Treemaps [Shneiderman, 1992] were invented by shneiderman to address this particular problem."[VanWijk et al., 2003]
References[edit]
- [Robertson et al., 1991] George Robertson, Jock D. Mackinlay, Stuart Card. Cone Trees: Animated 3D Visualizations of Hierarchical Information. In Proceedings of the ACM CHI 91 Human Factors in Computing Systems Conference, pages 189-- 194, April 28 - June 5, 1991, New Orleans, Louisiana, June 1991. Association for Computing Machinery
- [VanWijk, 2008] Jack van Wijk. Information Visualization Visual Analytics. I-science for Astronomy, October 13-17, 2008. Lorentz center, Leiden. Retrieved at: November 7, 2008. http://www.lorentzcenter.nl/lc/web/2008/321/presentations/VanWijk.pdf
- [Cockburn and Mckenzie, 2000] Andy Cockburn, Bruce Mckenzie. An Evaluation of Cone Trees. In People and Computers XIV: British Computer Society Conference on Human Computer Interaction 2000, p425--436. Springer-Verlag.
- [Ying-Huey Fua] Visualizing Hierarchies Via Exotic Trees, Worchester Polytechnic Institute, November 3, 2009. http://davis.wpi.edu/~matt/courses/trees/
- [Shneiderman, 1992] Ben Shneiderman. Tree visualization with tree-maps: A 2-D space-filling approach. ACM Transactions on Graphics 11, pages 92--99, 1992. Association for Computing Machinery
- [VanWijk et al., 2003] Jarke J. van Wijk, Frank Van Ham, Huub Van De Wetering. Rendering Hierarchical Data. Communications of the ACM, pages 257--263, 2003. Association for Computing Machinery