Teaching:TUW - UE InfoVis WS 2008/09 - Gruppe 02 - Aufgabe 1 - Parallel Coordinates
Parallel Coordinates[edit]
Definition[edit]
Revealed Information[edit]
When analyzing data, it is almost always the first step to get an overview and understand the data, its properties, distribution and pitfalls. In order to achieve this, usually the data is visualized. By visualizing multidimensional datasets with common coordinate systems human cognition is limited to few dimensions [Inselberg and Dimsdale, 1990]. The fourth dimension in 3d-diagramms can be visualized by using different colors, point-sizes or shapes. But this technique does not always point out the features you are interested in.
Parallel coordinates enable displaying multi dimensional datasets in coordinate systems by placing each dimension on its own axis and arranging these axes parallel to each other. Each point is put on the accordant axis; lines are drawn to connect related data points [Blumtritt, 2008]. Adding more dimensions in the Parallel Coordinates involves adding more axes.
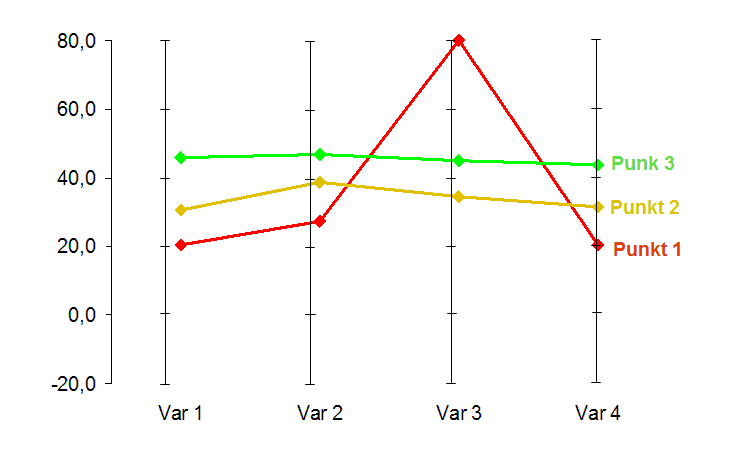
Figure1 shows the following three points with four dimensions (Var1 to Var4) in a parallel coordinate system:
- 1st Point (20,28,80,20)
- 2nd Point (30,39,35,31)
- 3rd Point (47,48,46,44)

As this figure demonstrates distinctive features can be easily found using this technique. In this way, distinctive features and the distribution of the data can be explored. One can see immediately, that the values of Punkt1 are somehow diverse. With the help of highlighting or linking and brushing also the data can be explored in more detail.
Real World Example[edit]
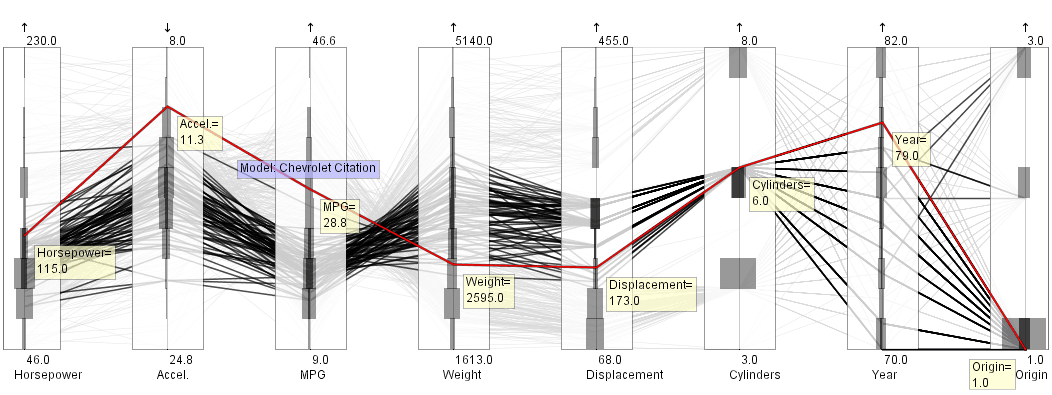
An example of Parallel Coordinates can be found when evaluating automobiles: the different axis are the horsepower, acceleration, the weight, cylinders etc. The lines crossing the axes represent the values corresponding to a particular car model. In Figure2 cars with six cylinders were emphasized through brushing, histograms are laid over axes, and one data-point is shown with all details. [Dürsteler, 2008], [Hauser, 2008].

Extruded Parallel Coordinates[edit]
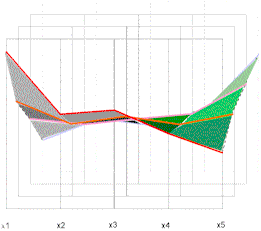
An extension of Parallel Coordinates are Extruded Parallel Coordinates. For each dataset a new set of axis is created and shifted along the z-axis as seen in Figure3. In interactive environments a clear overview can be given by drawing planes between polylines of two different datasets and tilting or rotating the model/ moving the point of view. [Rubik, 1997a].

References[edit]
- [Inselberg and Dimsdale, 1990] A. Inselberg, B. Dimsdale, Parallel Coordinates: A Tool for Visualizing Multi-Dimensionalgeometry in Proceedings of the First IEEE Conference on Visualization, 1990. Published at Oct 23-26, 1990. Retrieved at Nov 2, 2008. http://ieeexplore.ieee.org/xpl/freeabs_all.jsp?arnumber=146402
- [Rubik, 1997a] Günter Rubik, Extruded Parallel Coordinates. Created at July 19, 1997. Retrieved at Nov 2, 2008. http://www.cg.tuwien.ac.at/~rubik/extruded.htm
- [Rubik, 1997b] Günter Rubik, Parallele Koordinaten. Created at June 27, 1997. Retrieved at Nov 2, 2008. http://www.cg.tuwien.ac.at/~rubik/paracord.htm
- [Blumtritt, 2008] Jörg Blumtritt, Parallelkoordinaten. Created at Feb 28, 2008. Retrieved at Nov 2, 2008. http://www.scienceblogs.de/zahlenbilder/2008/02/parallelkoordinaten.php
- [Wikipedia, 2008] Wikipedia, Retrieved at Nov 2, 2008. http://en.wikipedia.org/wiki/Parallel_coordinates
- [Dürsteler, 2008] Juan C. Dürsteler, Visualisation in the 20th century. Retrieved at Nov 2, 2008. http://www.infovis.net/printMag.php?lang=2&num=112
- [Hauser, 2008] Helwig Hauser, Angular Brushing for Extended Parallel Coordinates. Retrieved at Nov 2, 2008. http://www.vrvis.at/via/research/ang-brush/index.html