Teaching:TUW - UE InfoVis WS 2008/09 - Gruppe 01 - Aufgabe 1 - Visual Encoding
Visual Encoding[edit]
Introduction[edit]
Firstly it's a must to mention that visual representations of information has some unsolved problems as well as advantages.
"The visual display of information allows people to become more easily aware of essential facts, to quickly see regularities and outliers in data, and therefore to develop a deeper understanding of data."[Dourish et al,2003]
Visual representations are widely used not only in business companies, universities, newspapers, etc.. ,but also in daily life these representations are everywhere around us. In this point it comes into question how the visualizations should be built up, to make the visual representations perceptible. Visual encoding and it's techniques help us with this, they are the guide of converting the data into a visual form.
Definition[edit]
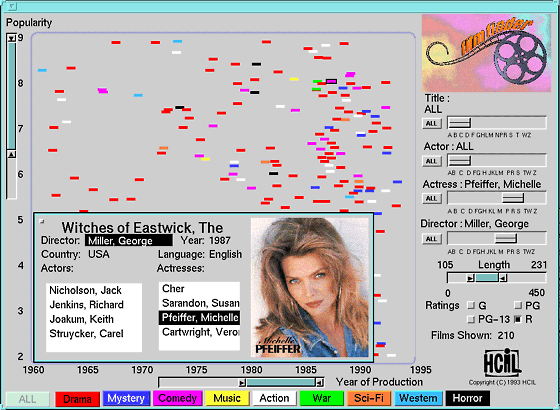
Visual encoding aims to represent data in a form that we all can perceive and it consists of some techniques to convert the data into a perceptible form. Thus enabling us to make visualization on any kind of display. For a visualization we need graphical elements to show the syntax of what we mean.
"Visual encoding is the set of techniques enabling the representation of data on a screen or on paper. It comprises of the use of shapes, colours, areas and other visual variables that make it possible to associate data variables to graphic variables [Dürsteler, 2005]."
"Visual encodings are mappings of information to display elements [Munzner, 2000]".
Techniques of Visual Encoding[edit]
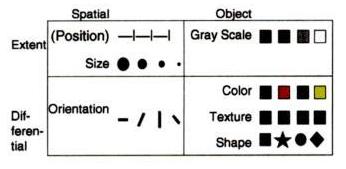
"The fundamental substrate of visualizations is spatial position. Marks such as points, lines, or area-covering elements can be placed on this substrate. These marks can carry additional information independent of their spatial position, such as size, greyscale luminance (brightness) value, surface texture density, color hue, color saturation, curvature, angle, and shape [Munzner, 2000]".
Six kinds of Visual Encoding:
- Space
- Marks
- Connections & Enclosures
- Retinal Properties
- Temporal Encoding
- Viewpoint Transformation
Space[edit]
When you think about an empty paper as the beginning of a visualisation, the space between some possible object is one of the most powerful aspects to give something an important note. It is the space where data is represented in a visualization.
Marks[edit]
Marks are the objects which are needed to represent the data in a visualization, that the data is into a perceptible form. Thus making the perception of the visual representation easier.
"Marks are the visible things that occur in space [Card et al., 1999]."
"Marks are simply any graphical symbol visible on a display medium [Ignatius and Senay, 1999]."
There are four types of simple Marks :
- Points
- Lines
- Areas
- Volumes
Connections & Enclosures[edit]
Connections and enclosures build the important dependencies between the objects (marks). Connections show a relationship between objects, while enclosures can also indicate related objects.
Retinal Properties[edit]
Simply retinal properties are all those properties of marks which have something to do with human eye perception. Thus describing how objects (marks) look like.
"A retinal encoding is any variation of the marks that the retina of the eye can perceive besides position [Ignatius and Senay, 1999]."
"Retinal properties are the informations that are carried by marks, such as crispness, shape, resolution, transperancy, color(value,hue & saturation), grayscale [Munzner, 2000]."

Temporal Encoding[edit]
A temporal encoding shows how the marks' properties vary over time.
"It's the encoding which depends on the temporal changes of marks (mark position and their retinal properties) [Ignatius and Senay, 1999]".
Viewpoint Transformations[edit]
"Viewpoint transformations modify interactively and augment Visual Structures to turn static presentations into visualizations by establishing graphical parameters to create Views of Visual Structures [Card et al., 1999; Jacko and Sears, 2002]."
In other words it is the modification of the view position of the viewer (or in general the modification of viewing parameters), thus enhancing the visual perception.
There are three common view transformations :
- Location Probes : Usage of Location in the visual structures to reveal additional info
- Viewpoint control : Moving the viewpoint to create visualisation : Pan,zoom,clip the viewpoint.
- Distortion : Creating a focus area and context area.

References[edit]
- [Card et al., 1999] Stuart K. Card, Jock D. Mackinlay and Ben Schneiderman. Readings in Information Visualization. Using Vision to Think. Morgan Kaufman Publ Inc, San Diego, 1999.
- [Dürsteler, 2005] Juan C. Dürsteler. Web Content Mining Visualisation. Created at: November 7, 2005. http://www.infovis.net/printMag.php?num=175&lang=2.
- [Ignatius and Senay, 1999] Ignatius Eve and Senay Hikmet. Data, vocabulary, marks, composition rules and visual perception rules. Created at: February 11, 1999. http://cose.math.bas.bg/Sci_Visualization/visConcepts/concepts/marks.htm.
- [Jacko and Sears, 2002] Julie A. Jacko and Andrew Sears.The Human-Computer Interaction Handbook: Fundamentals, Evolving Technologies. Lawrence Erlbaum Assoc in, NY, 2002.
- [Munzner, 2000] Tamara Munzner. Interactive Visualization of Large Graphs and Networks. Dissertation, Stanford University, June 2000. http://graphics.stanford.edu/papers/munzner_thesis/.
- [Waloszek, 2008] Gerd Waloszek. SAP AG, SAP User Experience. Selecting Objects By Attributes – Part II. Created at: October 3, 2008. http://www.sapdesignguild.org/community/design/attributes_2.asp.
- [Dourish et al,2003] Paul Dourish, Alfred Kobsa, Gloria Mark and David Redmiles. Information Visualization Research. Retrieved at: June, 2003. http://www.isr.uci.edu/research-visualization.html.