Teaching:TUW - UE InfoVis WS 2007/08 - Gruppe 09 - Aufgabe 1 - Graphical Integrity
Defnition[edit]
Therefore it has to be ensured that the visual representation of the data is consistent with its numerical representation. This can be done by avoiding visual distortion. Sometimes graphs
are used to confuse or mislead the naive viewer but that is not a very honorable goal. Graphs that have Graphical Integrity are tools for exploring complicated data, and gaining new
insight into quantitive information. In order to create a good graph the human perception hast to be taken into acount. Different people have different perceptions which also change with experience.
Principles to ensure Graphical Integrity[edit]
Tufte stated that
This means that each effect on the data should have an effect of equal size on the graph. This is called the Lie Factor of the graph. A Lie Factor that differs from 1 indicates
distortion in the graph which leads to less Graphical Integrity.
Another principle to ensure Graphical Integrity is to use clear, detailed, and thorough labeling in order to defeat graphics distortion and ambiguity. The data should be explained on the
graphic and important data points should be labeled.
Tufte also formulated a principle regarding displays of money, he stated that
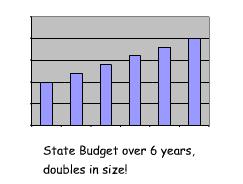
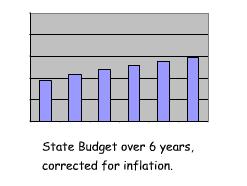
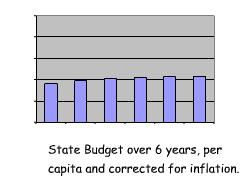
The following pictures show graphs of government spending over time. In the first one shows the spending in dollars which are not corrected for inflation. This falesly suggests that the
spending has increased over the last years. In reality the value of the dollar has decreased due to inflation. Picture 2 shows the same graph with corrected values. Furthermore the first graph doesnt take the potential increase in state population into acount which also affects the integrety of the graph. Picture 3 shows the same graph corrected for
state population.
Another important principle stated by Tufte is
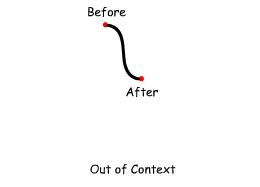
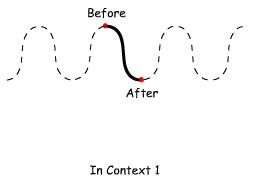
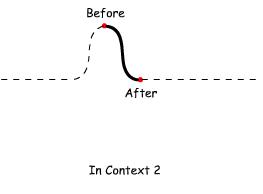
If a graphic shows data out of context the viewer could be mislead because he has no information needed for comparison. A different context can lead to very differing interpretations of
the data. The following pictures illustrate the problem.
References[edit]
[Tufte, 1991] Edward Tufte, The Visual Display of Quantitative Information, Second Edition, Graphics Press, USA, 1991.
[Childs, 2007] Christopher Childs, Encyclopedia of Educational Technology, The SDSU Department of Educational Technology, Retrieved at: November 8, 2007.
