Teaching:TUW - UE InfoVis WS 2007/08 - Gruppe 08 - Aufgabe 1 - Theme River
Jump to navigation
Jump to search

Definitions[edit]
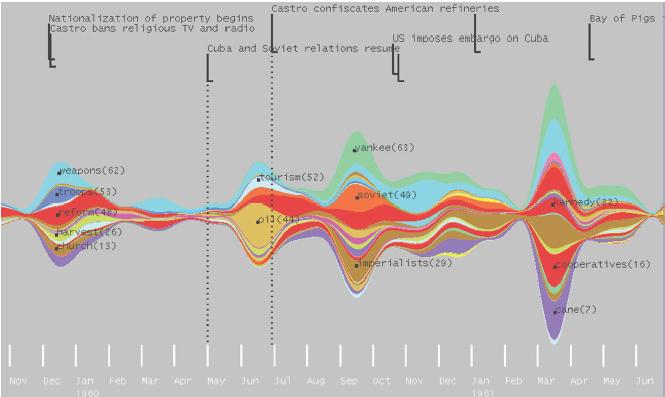
The ThemeRiver visualization depicts thematic variations over time within a large collection of documents. The thematic changes are shown in the context of a time line and corresponding external events. The focus on temporal thematic change within a context framework allows a user to discern patterns that suggest relationships or trends. For example, the sudden change of thematic strength following an external event may indicate a causal relationship. Such patterns are not readily accessible in other visualizations of the data. We use a river metaphor to convey several key notions. The document collection's time line, selected thematic content, and thematic strength are indicated by the river's directed flow, composition, and changing width, respectively. The directed flow from left to right is interpreted as movement through time and the horizontal distance between two points on the river defines a time interval. At any point in time, the vertical distance, or width, of the river indicates the collective strength of the selected themes. Colored "currents" flowing within the river represent individual themes. A current's vertical width narrows or broadens to indicate decreases or increases in the strength of the individual theme.
[Havre et al., 2002]
ThemeRiver is a prototype system that visualizes thematic variations over time across a collection of documents. The "river" flows through time, changing width to depict changes in the thematic strength of documents temporally collocated. Themes or topics are represented as colored "currents" flowing within the river that narrow or widen to indicate decreases or increases in the strength of a topic in associated documents at a specific point in time. The river is shown within the context of a timeline and a corresponding textual presentation of external events.
[Havre et al.]
Pros[edit]
- It provides an overview
- Changes in themes are easily visualizable
- Zooming to specific and/or exact period of time
- Its a time slice and not summarized with bars like in a histogram
- Contextual information
- Easy to interpret and use
- Switch particular theme labels on and off
Contras[edit]
- It is not possible to filter out exact data
- Color blind people may have problems reading the ThemeRiver if it only is presented in colors and without texture
Usage[edit]
Theme Rivers can be used for many different purposes, e.g.:
- political actions
- survival rate of soldiers in different positions
- economic actions
- water level in different countries
- military actions
- international events
- ...
3D-ThemeRiver[edit]
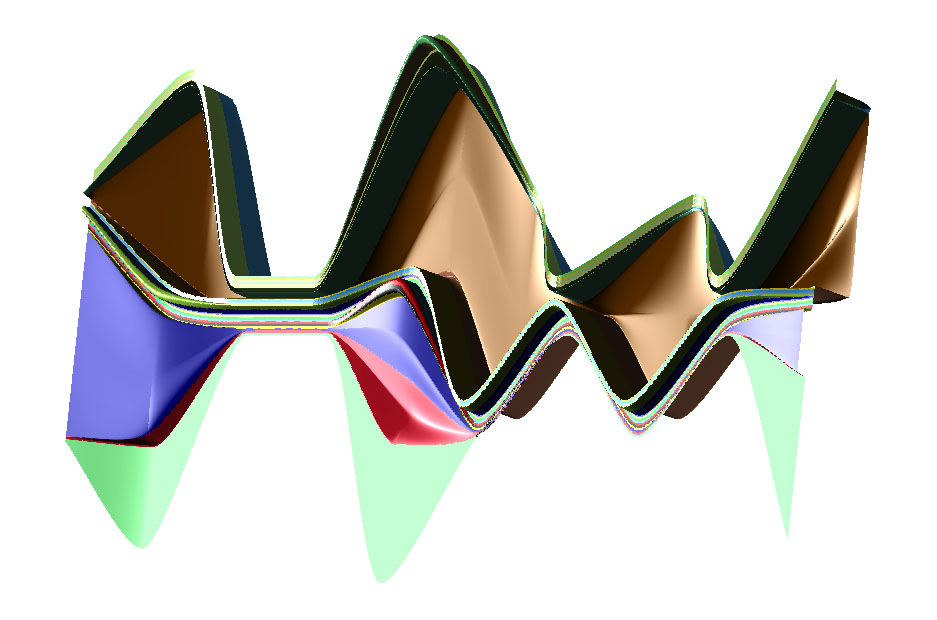
A ThemeRiver can be sketched as a 3D-Visualization as well. This version adds an additional variable to a 2D version. The 3D ThemeRiver preserves colors and reflects the changes of iron occurrence on the z-axis.
Quotation[edit]
A limitation of the existing ThemeRiver paradigm is that only one attribute can be displayed per theme. In this poster, we present a 3D extension, which enables us to display two attributes of each variable in the data stream. We further describe a technique to construct the Bezier surface that satisfies the ThemeRiver requirements, such as boundedness and preservation of local extrema.
[Imrich et al., 2004]

References[edit]
- [Havre et al., 2002] Susan Havre, IEEE Computer Society, ThemeRiver: Visualizing Thematic CHanges in Large Document Collections, Vol.8. No.1., January-March 2002 http://www.cg.tuwien.ac.at/courses/InfoVis/HallOfFame/2004/05_ThemeRiver/papers/ThemeRiverIEEE2002.pdf
- [Imrich et al., 2004] Peter Imrich, Center for Visual Computing, Computer Science, Stony Brook University, Interactive Poster: 3D ThemeRiver, 2004 http://www.cg.tuwien.ac.at/courses/InfoVis/HallOfFame/2004/05_ThemeRiver/papers/3DThemeriver.pdf