Teaching:TUW - UE InfoVis WS 2007/08 - Gruppe 03 - Aufgabe 4
Aufgabenstellung
Aufgabe ist das Design einer interaktiven Visualisierungsapplikation zur Darstellung und Exploration
(des zeitlichen Verlaufs) von Laborwerten einer Blutuntersuchung. BenutzerInnen, Einsatzzweck, Tasks, etc.
sollen von Euch selbst festgelegt und beschrieben werden.
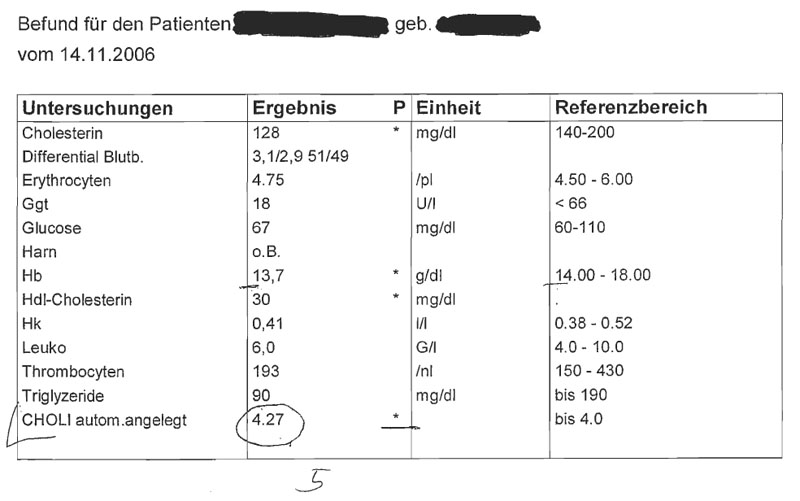
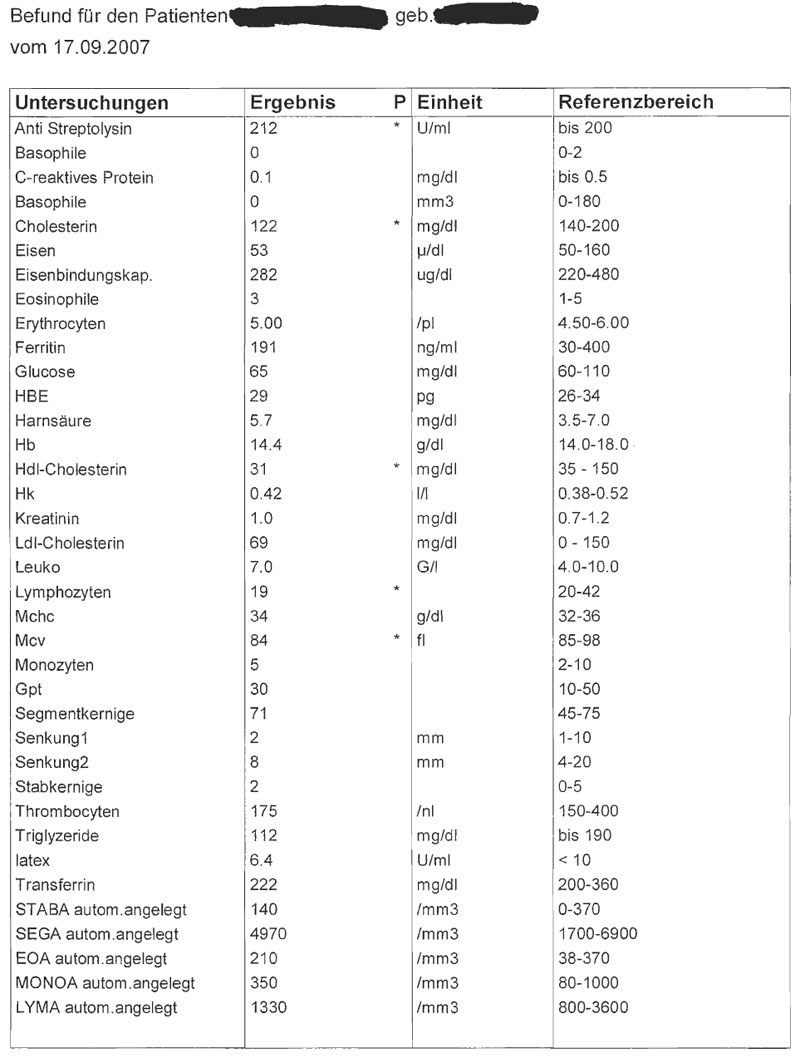
Beispiele für derartige Datensätze
Solution
a)
Area of the application
Patients of a lab should have the possibility to compare their data of their findings. Furthermore the patients should get Information about possible reasons, effects and introductions of bad values.
This service should be offer as an web application.
Analyses of datasets
Each dataset consists of the following data types:
- analysis (nominal)
- outcome (discrete)
- unit (nominal)
- reference interval (interval)
Each dataset has a pointer to a finding.
Each finding has a data and has a pointer to a patient.
Analyses of the target group
The patient of the lab are the target group.
Medic can also use the system. If the system would be developed only for medics, the main difference will be, that it does not need as much additional information such as introductions.
Goal
The patients should be able to evaluate the outcomes of the findings without the help of an medic. Furthermore the patients should be able to follow the developing of the outcomes of the findings. If it is better to contact a medic, it should be recommend.
b)
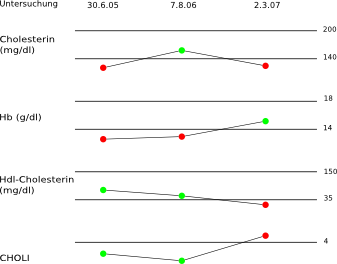
Fake Screenshot
This graphic show the devoloping of some outcomes of some findings. The black lines shows the reference intervals. The green points shows good outcomes and the red points shows bad outcomes.


