Teaching:TUW - UE InfoVis WS 2007/08 - Gruppe 03 - Aufgabe 3
Poor Graphic
 A New Set of Projections for the U.S. Supply of Energy
Solution
Criticism
The graphic has a low data ink ratio. The third dimension do not contains any information and is only confusing.
The bar are too thick.
Begründen, warum (es fehlt an "white space" zwischen den Balken)
The legend is too near to the bars. An additional information to the legend is placed far away from the legend.
Die Legende würde ich nicht als zu nahe erachten. Man soll mit einem Blick auch die Bedeutung der Legende erfassen können.
The labels of the bars are not placed on the exact high as the bars. If they are placed better, there is no need for their arrow border.
It would be better if the bars were vertical and not horizontal.
Begründen, warum
It would be better if the amount of the numbers is in the graphic and not in the sub header.
Begründen, warum
There is no information in the header of in the footer when the graphic was created.
Anm.: Ihr meint wohl den Zeitpunkt / Zeitspanne, zu dem die Daten erhoben wurden und nicht, wann die Grafik erstellt wurde, oder?
Maybe it would be good to do a little different graphical presentation of the supply from 1977 and the projections.
Was meint ihr? Konkretisieren
insgesamt sehr wenig Text (Begründungen fehlen)
Improved graphic
Explanation of improvements
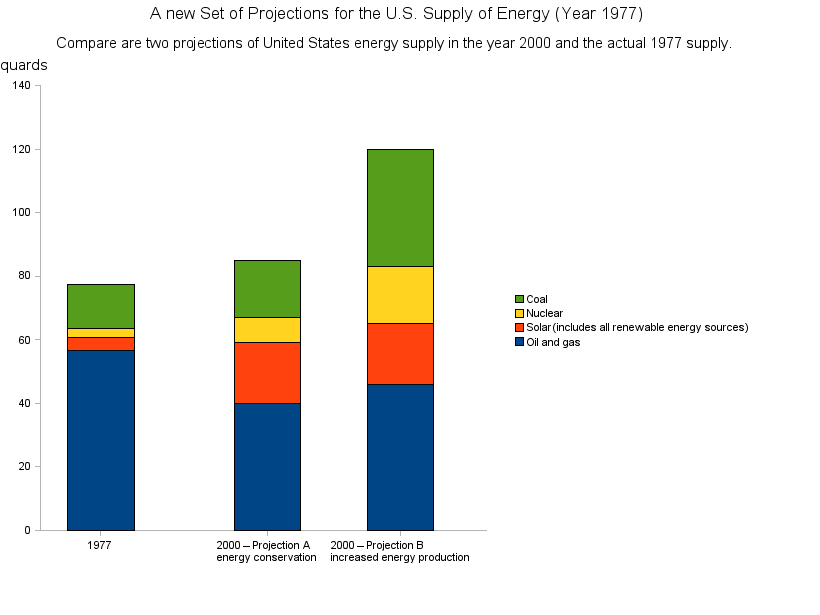
The most criticism form point 2.1 are corrected.
The two projections have a more detailed label and the space between the bar of 1977 and the first bar of a projection is bigger then the space between the bars of the two projections.
The Y-axis has a label with the amounts.
The information which is presented is reduced to the minimum.
Sonstiges:
- Titel / Untertitel könnten noch auf das wesentliche reduziert werden (Comparison of ...) Redundanz vermeiden.
- Legende: "Renewable Energy Sources" würde vollkommen ausreichen, da Solar ohnehin eine Teilmenge davon ist.
- Tick marks an der x-Achse sind hier überflüssig, da keine quantitative Skala.
- Konturlinien um die Balken herum wären nicht unbedingt notwendig.
- Es reicht, wenn in der Überschrift auf Jahr 2000-Prognosen hingewiesen wird.
Als Label würde 1977: Actual Energy Supply 2000: Energy Conservation bzw. 2000: Incresead Energy Production ausreichen.
