Teaching:TUW - UE InfoVis WS 2006/07 - Gruppe 08 - Aufgabe 3 - Technique
Technique[edit]
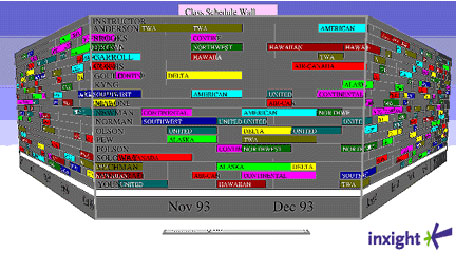
We are interested in visualisation techniques that are especially well suited for data with an important time-dimension. Thus our choice would be Perspective Wall or Theme River. We are not sure yet, which one is suited better, so we would like to regard both, as long as possible. Perspective Wall is suited better for a detailed display of the data (with no aggregation), whereas Theme River requires some kind of integration and would be better suited for an aggregated overview. Moreover the important elements of Perspective Wall (bifocal display with distortion on the off-center viewports) are better supported by prefuse.

Data[edit]
How can we describe the usage of a technique without defining the data we want to present?
There are various data structures, for which this display technique could be suitable. We want to focus on a Diary: Person(s) meeting other persons and being at places. There are two types of Diary: one for planning, ie noting what one person is going to do, the other one for protocolling, ie what the person already did.
The data will most likely be available in tabular form with the three dimensions being people, time and place. Prefuse provides extensive data input capabilities for tabular data that can be used.
Visual Mapping[edit]
Basic dimension is time. It is mapped to the horizontal axis. The selected/viewed time-slice is presented in the primary focus. The primary granularity of the time-slice is planned to be one month, but other levels of granularity would make sense as well.
Other dimensions are places and people. As long as one person is examined, the ribbon could be sliced vertically, according to places, where the person is, as one person can be only on one place at one time.
Other persons, ie persons the examined person meets or mentions, should be displayed in separate, parallel horizontal slices (in Perspective Wall). This makes the gist of the data (who met whom where and when?) visible at one glance.
Interaction[edit]
- Scrolling the time axis (back and forth)
- Navigation to special time-slice
- Optionally zooming the time axis (from whole regarded data set to one day; this partly overlaps with the setting of the granularity of the time-slice, ie size of the main focus)
- Query on places and persons visualized either as restriction (filtering) or through highlighting.
Prototype[edit]

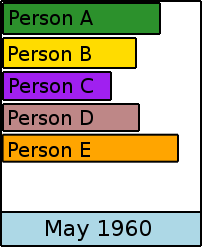
Note: This image is an extremely simplified draft. It only demonstrates the amount of interaction with other persons in a given time period, ignoring space entirely. The region of interest here is one month (this can obviously be changed interactively).
The length of the individual rectangles (persons) could represent the number of meetings or the cumulative time spent with the person in the given interval.
The off-center display areas would look similar but would obviously be compressed, following the concept of the Perspective Wall pictured above.