Teaching:TUW - UE InfoVis WS 2006/07 - Gruppe 03 - Aufgabe 1 - InfoZoom
Definition[edit]
InfoZoom processes different types of data, which can be displayed in table form. The core piece of InfoZoom is a very innovative visualisation technique, that allows to display large ammounts of data in three different view modes.
InfoZoom is developed by the company humanIT, a spin-off of Fraunhofer Society and subsidiary company of proALPHA Software AG. [humanIT, 2006]History[edit]
InfoZoom evolved from another system called FOCUS, a focus+context table layout [Kort, 2004].
The current and newest version is InfoZoom V6.0 [humanIT, 2009].
Description[edit]
Overview[edit]
Primarily, InfoZoom was developed for manipulating tables. By default it uses parallel bargrams for larger sizes of data sets and special focus+context tables for smaller ones [Wittenburg et al, 2001]. So it is possible to present information in table or distribution oriented formats.
When displaying relational data tables, InfoZoom uses one row for each record. This data can be sorted sequential, hierarchical or in any other way the user wants it to be sorted. If necessary, the user can "zoom" into the information. This happens for example by doubleclicking on attribute values or sets/ranges of values [Mark et al, 2003]. This "zooming" can also be done by selecting columns of a row interactively and then promoting them into qualified records. All other records except those marked as qualified records are hidden instantly, enabling a "zoomed" view on the information.
InfoZoom supports data selection and filtering by a single mouse click on a value bin. Values can be rendered interestingly and transitions between set sizes are animated [Wittenburg et al, 2001].

Data Source & Compatibility[edit]
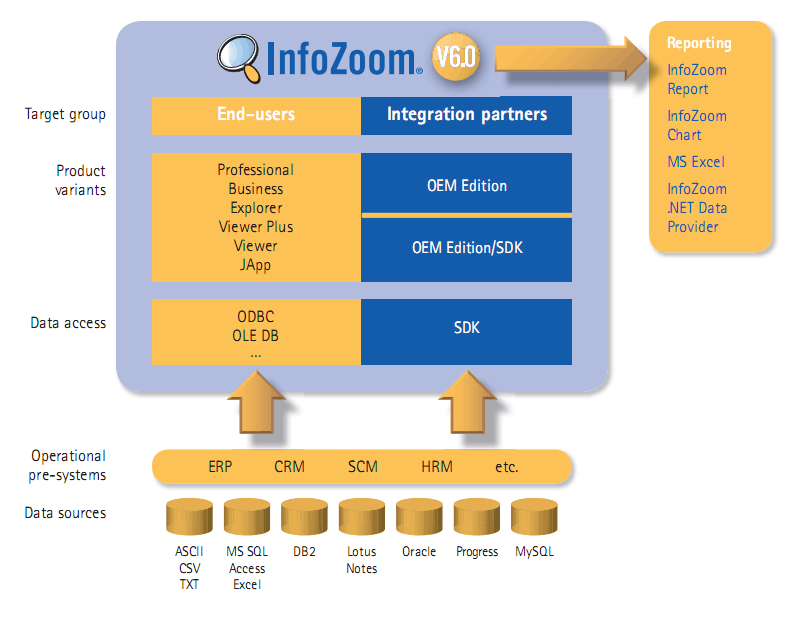
With its versatility and open architecture for quick and easy OEM installation based on commonly used industry standards (ODBC, OLE DB, OLE DB for OLAP, COM, ActiveX) and native interfaces (proALPHA, SAP, Lotus Notes, etc.), InfoZoom offers a major advantage for integration partners. It can also be used as a stand-alone application under Windows. [humanIT, 2009]
View Modes[edit]
InfoZoom offers three modes for data analysis: wide table, compressed table and overview [Xie, 2006; Fraunhofer-Institut für Angewandte Informationstechnik FIT, 2009].
Wide Table[edit]
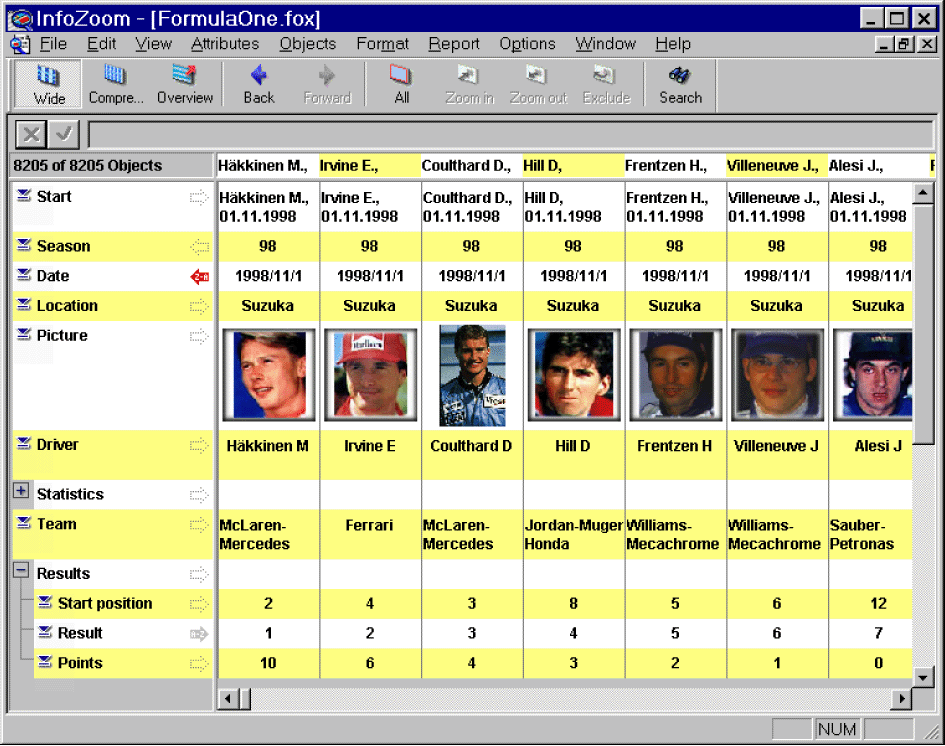
The wide table looks like a table we know from spreadsheets or database tables. Every attribute is shown as a row and the objects as columns. If the windows is not big enough to show all records or attributes, it's possible to scroll vertically or horizontally. [Xie, 2006]
Compressed Table[edit]
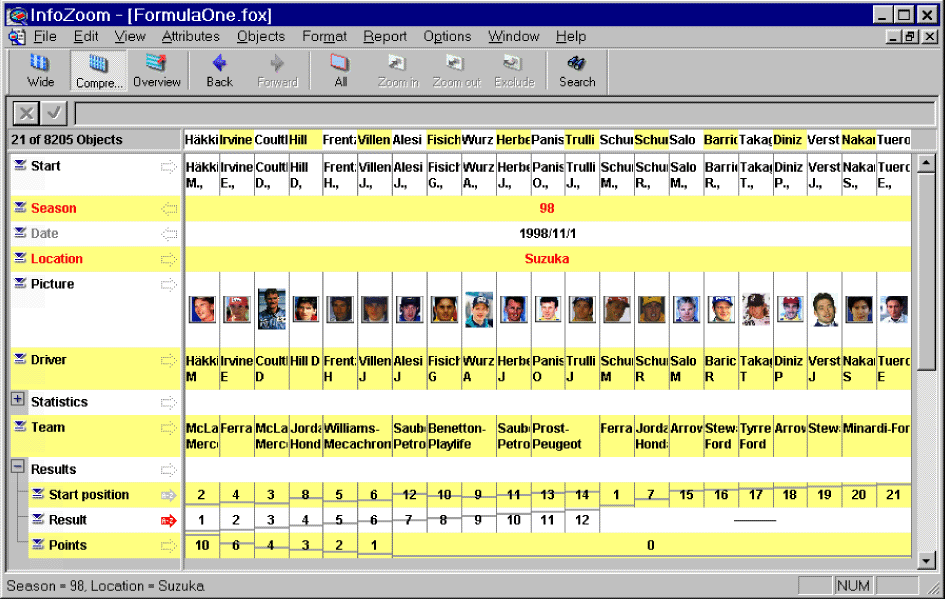
The compressed table shows all the objects on the screen. Therefor, the objects have to be pushed together. The entries in the database can be sorted either in ascending or descending order, numerical values are displayed by the vertical position of dots. [Xie, 2006]
Overview Mode[edit]
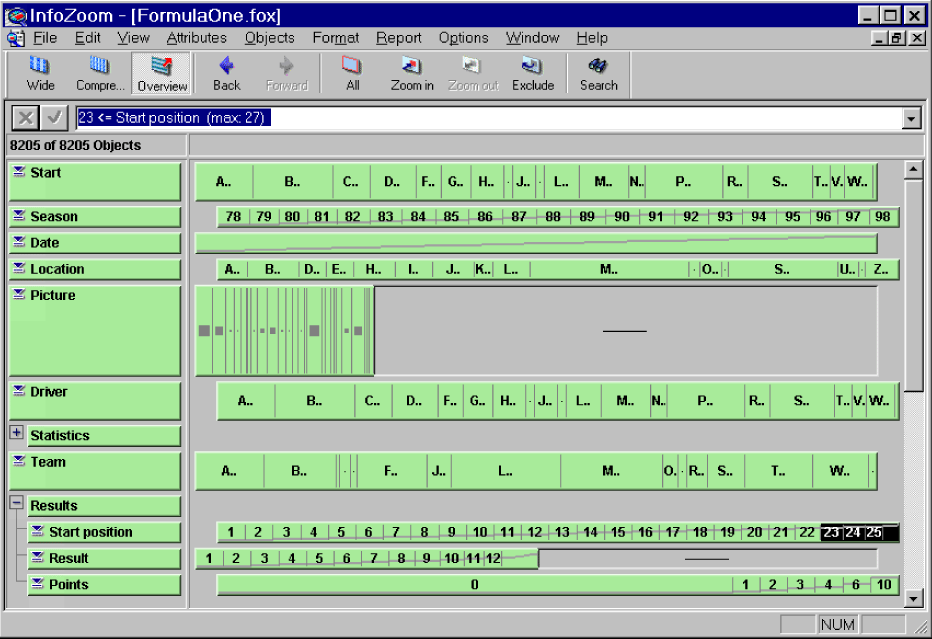
In the overview mode it is possible to sort the content independently for every attributes row, identical values are placed together in a cell. The frequency of this value is represented as the column width. [Xie, 2006]
Filter[edit]
The user can search for data or find patterns in a dataset by using filters. It is possible to look for a specific value or value range on an attribute. [Xie, 2006]
Derived Attribute[edit]
Attributes and derived atrributes can be combined by the user. The new value is calculated from the values of one or two already existing attributes.
Graphics Report[edit]
Graphic Reports can be created with different styles, e.g. Pie, Donut, Bar, Horiz Bar, Line, Area, Point, Bubble, Volume, ...
Use[edit]
InfoZoom is often used for Visual Data Mining (VDM), a process which aims at the recognition of patterns in data by an human expert. VDM makes use of an technique called focus+context. Here, it's possible for the expert to show focused and contextual information at the same time. [Kort, 2004]
Infozoom can be used for a wide range of areas, such as:
- Ad hoc evaluation
- Data cleansing
- Data selection
- Data management
- Data format verification
- Data migration
- Data plausibility
- Data quality
- Data checking
- Gap analysis
[humanIT, 2009]
Example[edit]
An example of a special Version of InfoZoom called 'InfoZoom JApp', which is used to present data on the internet or intranet, can be viewed at the InfoZoom homepage: http://www.infozoom.com/files/japp/bank/enu/index.html
References[edit]
[humanIT, 2009] Author unknown, InfoZoom. humanIT Software GmbH. Created at: 2009. Retrieved at: November 4, 2009. http://infozoom.com/244/-/product.html
[humanIT, 2006] Author unknown, InfoZoom. humanIT Software GmbH. Retrieved at: October 30, 2006.
[Kort, 2004] Alexander Kort. Visual Data Mining and Zoomable Interfaces. In Proceedings of the 9th international conference on Intelligent user interface. pages 274-276, New York, NY, 2004. ACM Press
[Mark et al, 2003] Gloria Mark, Keri Carpenter, Alfred Kobsa. Are There Benefits in Seeing Double? A Study of Collaborative Information Visualization. In CHI '03 extended abstracts on Human factors in computing systems, pages 840-841, Irvine, CA, April 2003. ACM Press
[Spenke, 2000] Michael Spenke and Christian Beilken. InfoZoom - Analysing Formula One Racing Results With an Interactive Data Mining and Visualisation Tool. In Second Conference on Data Mining 2000, pages 1-11, Cambridge, UK. Created at: July 2000, Retrieved at: November 6, 2009. http://www.ifs.tuwien.ac.at/~silvia/wien/vu-infovis/articles/spenke00infozoom.pdf
[Wittenburg et al, 2001] Kent Wittenburg, Tom Lanning, Michael Heinrichs, Michael Stanton. Parallel bargrams for consumer-based information exploration and choice. In Proceedings of the 14th annual ACM symposium on User interface software and technology, pages 51-60, Waltham, MA, November 2001. ACM Press
[Xie, 2006] Zaixian Xie, Review on InfoZoom. Worcester Polytechnic Insitute: Course Data Visualization. Created at: February 1, 2006. Retrieved at: November 6, 2009. http://users.wpi.edu/~xiezx/courses/cs525d/infozoom/infozoom.htm
[Fraunhofer-Institut für Angewandte Informationstechnik FIT, 2009] Fraunhofer-Institut füt Angewandte Informationstechnik FIT. InfoZoom - Ein Werkzeug zur Informationsvisualisierung Created at: August 27, 2009. Retreived at: November 22, 2009. http://www.fit.fraunhofer.de/projects/prozesse/infozoom.html


