Uploads by UE-InfoVis1011 0508080
Jump to navigation
Jump to search
This special page shows all uploaded files.
| Date | Name | Thumbnail | Size | Description | Versions |
|---|---|---|---|---|---|
| 22:03, 16 November 2010 | UE-InfoVis1011 0508080img exp2 2.jpg (file) |  |
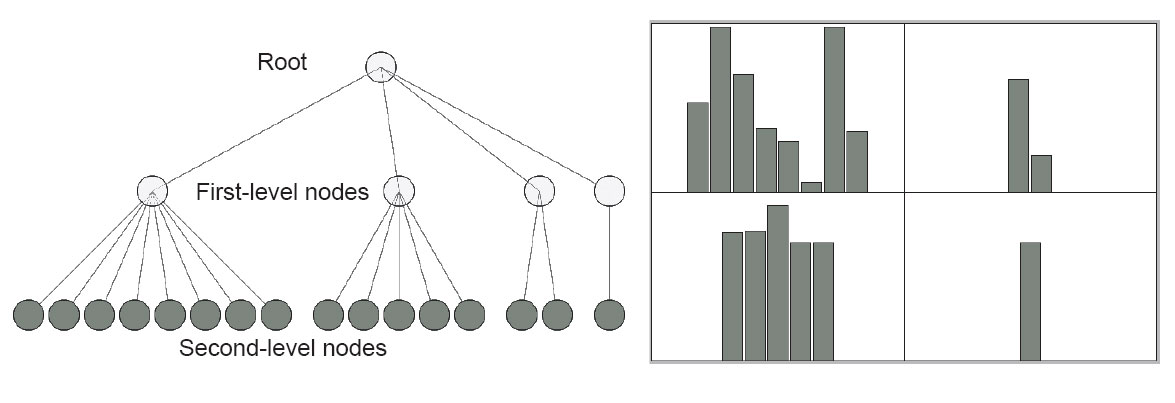
42 KB | Fig. 10. A sample tree shown as (a) a node-link tree, and (b) a hierarchical bar chart. Each group of sibling leaves form a cell of bar charts. | 1 |
| 22:03, 16 November 2010 | UE-InfoVis1011 0508080img exp2 1.jpg (file) |  |
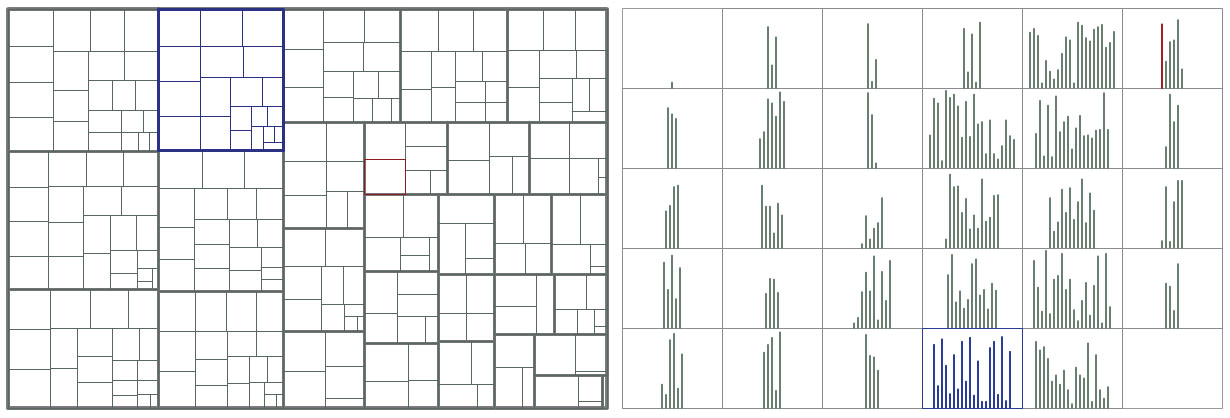
101 KB | Fig. 9. Example Exp. 2 stimuli with 256 leaves. (a) Squarified treemap. (b) Hierarchical bar chart; each bar represents a leaf node and sibling bars are grouped together in a cell. The charts depict the same data. | 1 |
| 22:00, 16 November 2010 | UE-InfoVis1011 0508080img exp1 1.jpg (file) |  |
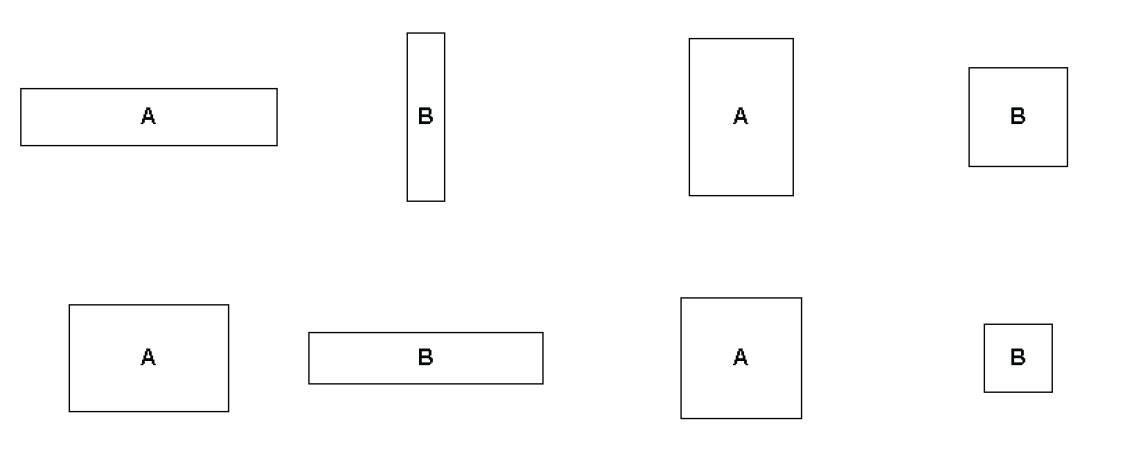
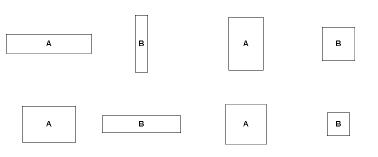
15 KB | Example stimuli from the aspect ratio study. Rectangles varied in terms of both percentage difference and aspect ratio | 1 |
| 21:02, 16 November 2010 | UE-InfoVis1011 0508080img exp1 1.gif (file) |  |
1 KB | Example stimuli from the aspect ratio study. Rectangles varied in terms of both percentage difference and aspect ratio. | 1 |