Uploads by UE-InfoVis09-05
Jump to navigation
Jump to search
This special page shows all uploaded files.
| Date | Name | Thumbnail | Size | Description | Versions |
|---|---|---|---|---|---|
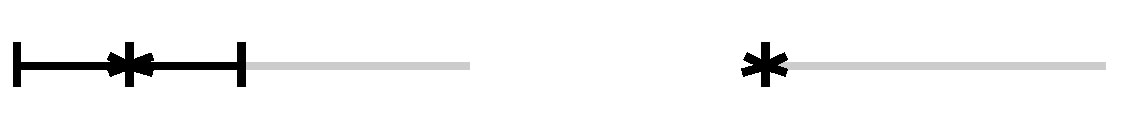
| 17:20, 26 May 2009 | Midgaard validtime granularity.jpg (file) | 13 KB | The valid time of a value is represented by a gray horizontal line. The granularity of a data point (left: a more coarse occurrence time than the actual timeline scale, right: a more precise occurrence time) is represented by a small mark or by an extende | 1 | |
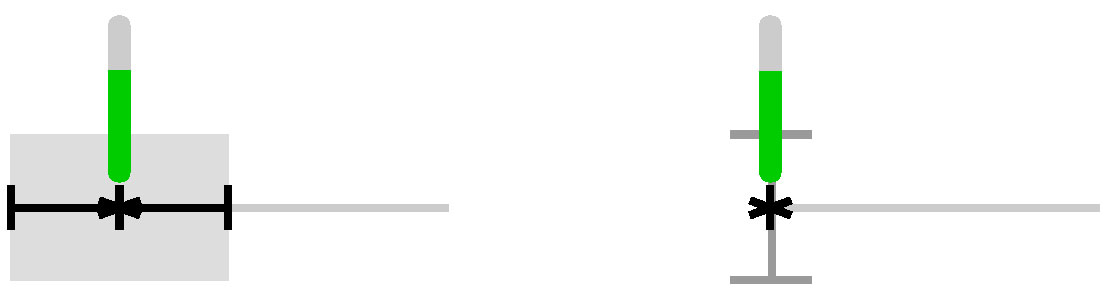
| 17:19, 26 May 2009 | Midgaard trustability.jpg (file) | 22 KB | The trustability of a data point is represented by a green filled bar. | 1 | |
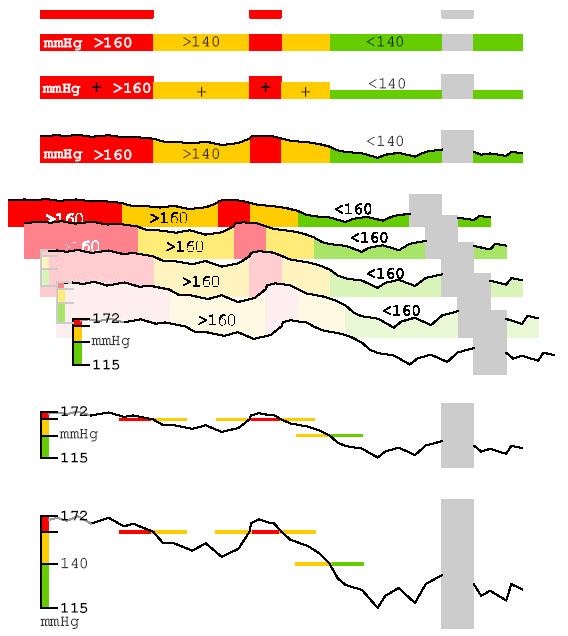
| 17:18, 26 May 2009 | Midgaard semanticzoom.jpg (file) |  |
92 KB | Semantic Zoom: Different representations of on data stream provide a broad overview as well as the fine structure of the data and several representations in-between (gray areas indicate missing values). | 1 |
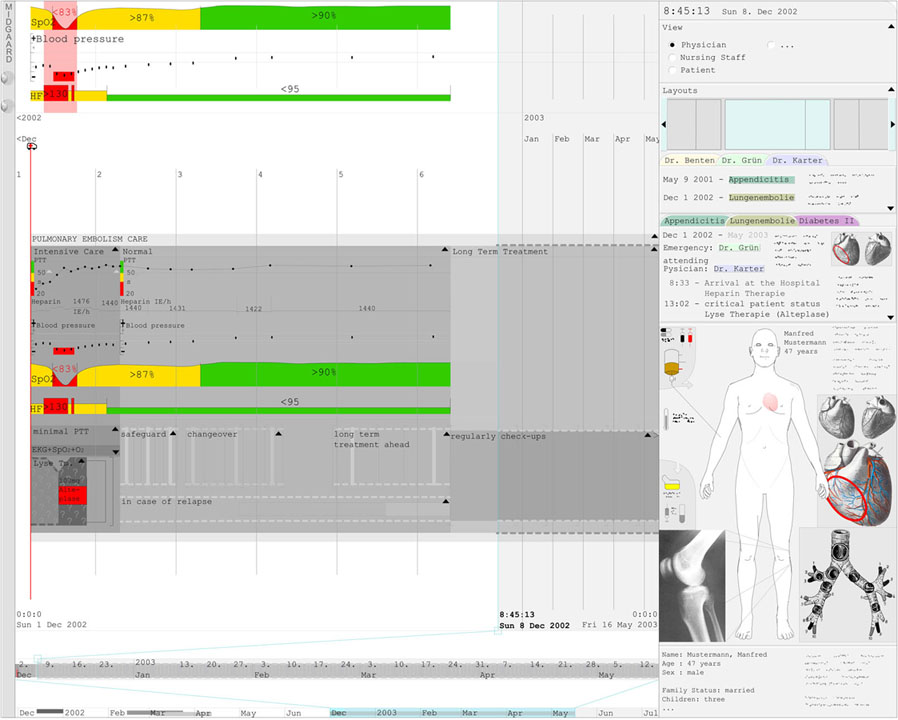
| 17:17, 26 May 2009 | Midgaard screenshot.jpg (file) |  |
115 KB | Screenshot of the Midgaard prototype. | 1 |
| 17:09, 26 May 2009 | Midgaard measurementdeviations.jpg (file) | 18 KB | Visualization of measurement deviations (e.g. ± 1%): the corresponding range of values is marked. | 1 | |
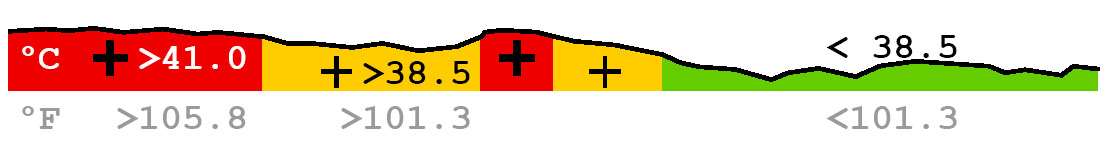
| 17:05, 26 May 2009 | Midgaard hybrid.jpg (file) | 41 KB | Qualitative - Quantitative Hybrid: the fever curve is enhanced with color-coded qualitative regions. | 1 | |
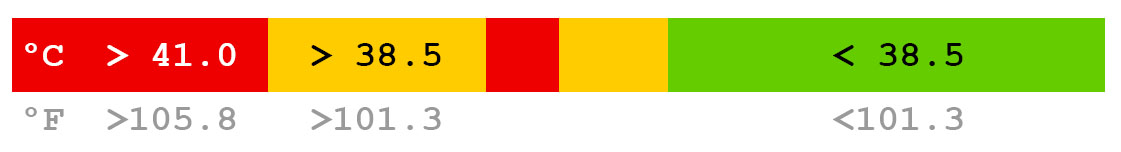
| 17:00, 26 May 2009 | Midgaard colorcoded timeline.jpg (file) | 33 KB | Color-coded timelines to visualize qualitative data. | 1 | |
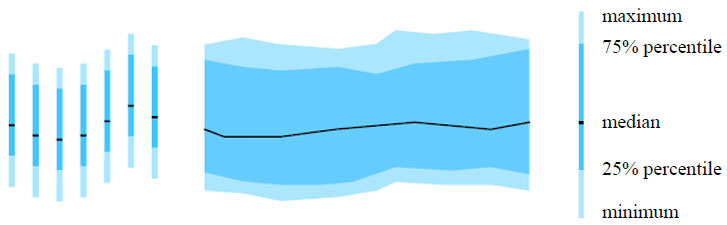
| 16:57, 26 May 2009 | Midgaard boxplot.jpg (file) |  |
35 KB | A redesign of John Tukey's box-plot - inspired by [Tufte, 1983]: allows for visualizing a full data stream of high-frequency data on limited display space. | 1 |
| 08:52, 15 May 2009 | Schlechtweg stefan.jpg (file) |  |
82 KB | 1 | |
| 18:47, 14 May 2009 | Ragnar bade.jpg (file) |  |
20 KB | 1 |