Uploads by UE-InfoVis0809 9607701
Jump to navigation
Jump to search
This special page shows all uploaded files.
| Date | Name | Thumbnail | Size | Description | Versions |
|---|---|---|---|---|---|
| 19:11, 7 January 2009 | Aufgabe4 S.jpg (file) | 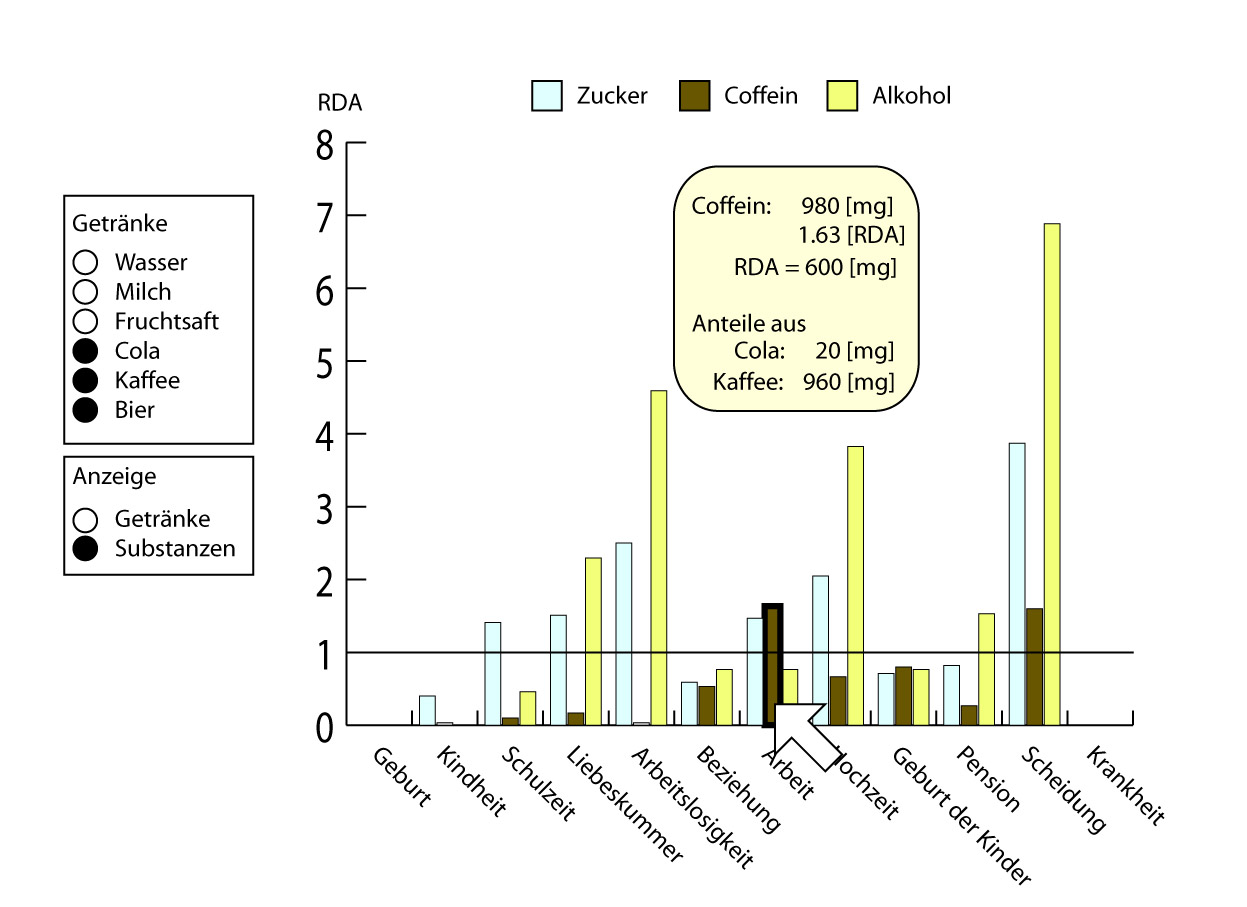 |
133 KB | View of substance RDA per period. | 1 |
| 19:10, 7 January 2009 | Aufgabe4 G.jpg (file) | 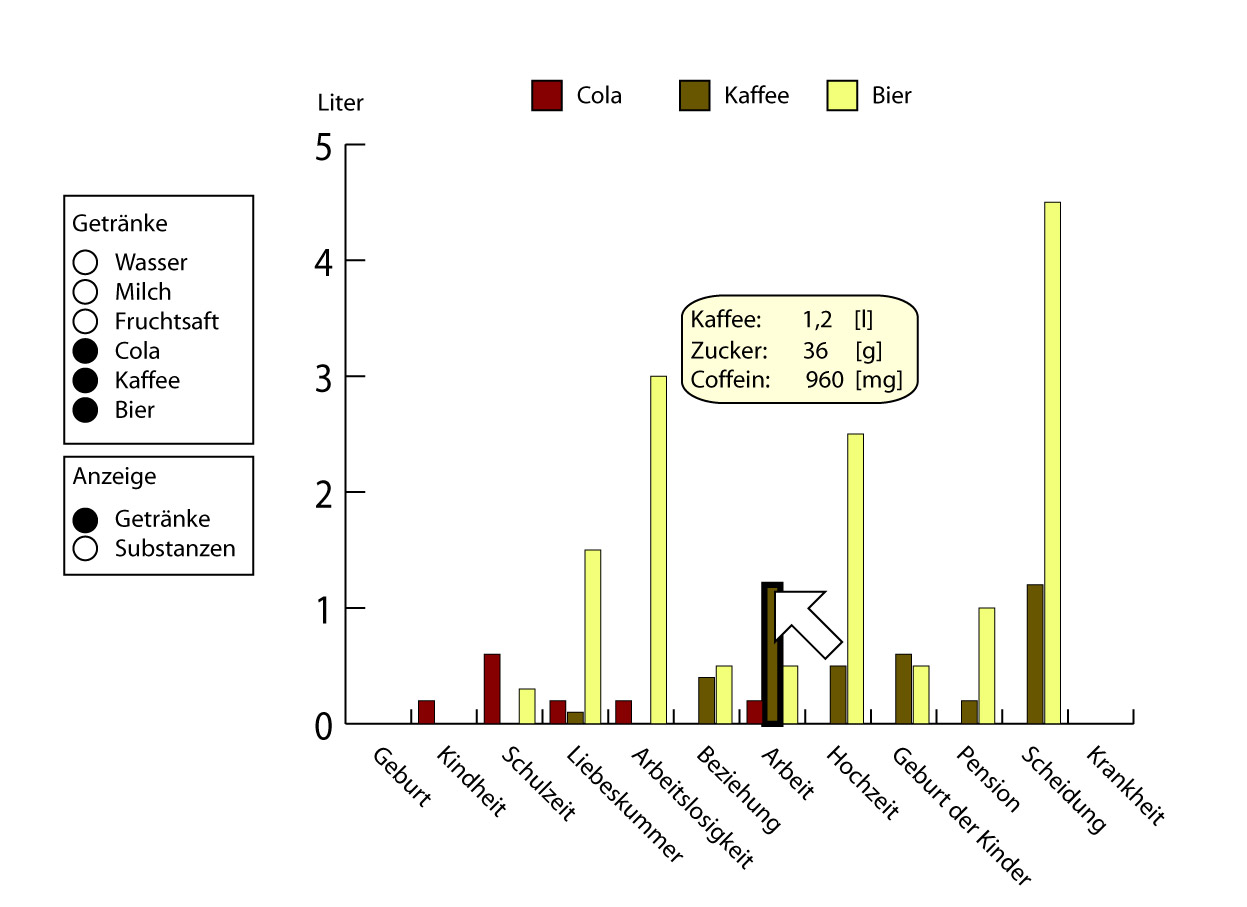 |
117 KB | View of three selected drinks per period. | 1 |
| 15:46, 23 December 2008 | CorrectedDiagram.png (file) | 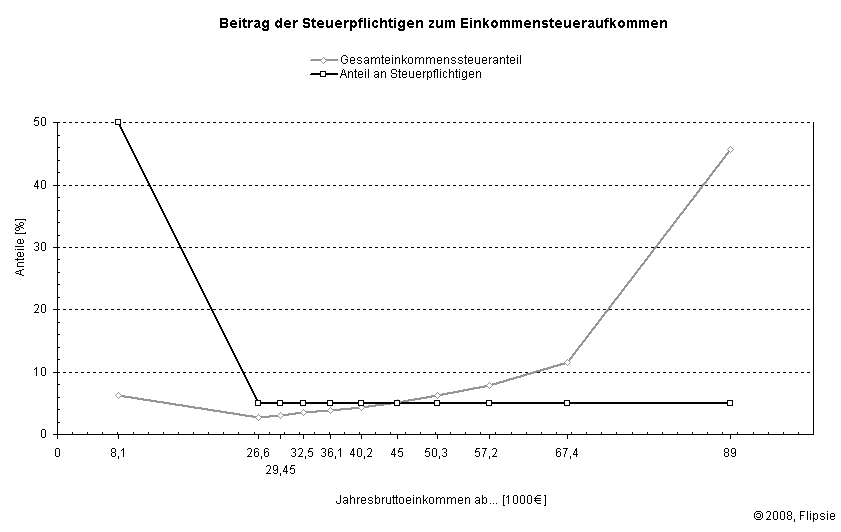 |
10 KB | 1 | |
| 23:43, 6 December 2008 | Teaching DiagramVariante2d.jpg (file) | 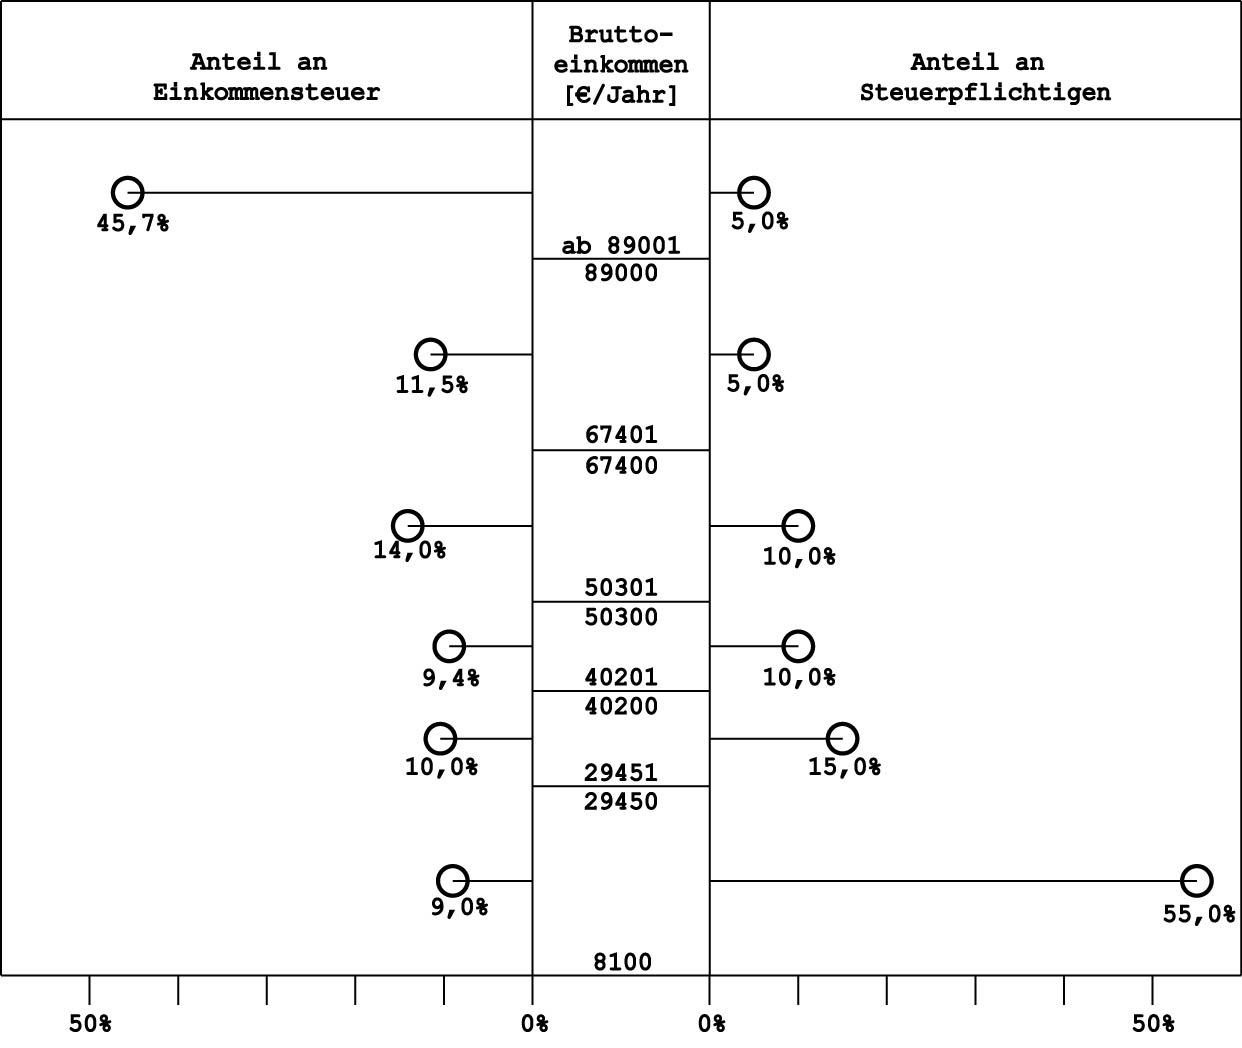 |
77 KB | 1 | |
| 21:13, 16 November 2008 | Hr diagram local.png (file) | 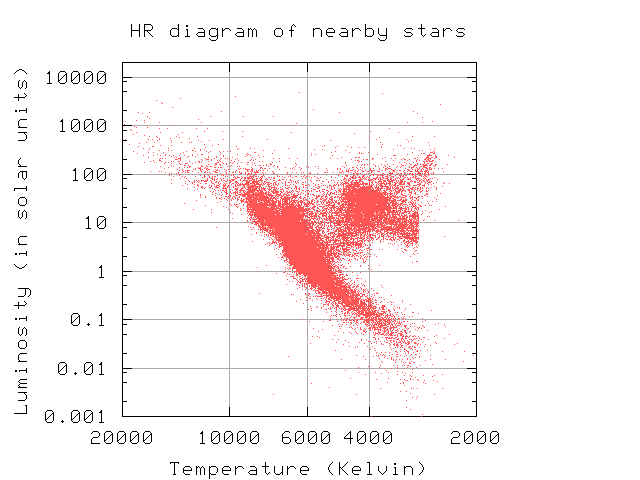 |
9 KB | HR diagram of some nearby stars. | 1 |
| 18:49, 16 November 2008 | Plot4D.png (file) | 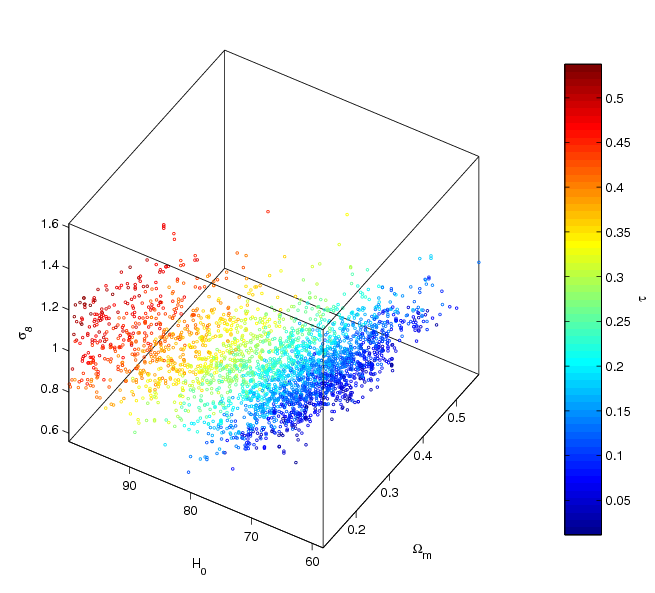 |
102 KB | Example of four-dimensional scatterplot done with Matlab's plot4D. | 1 |
| 22:49, 2 November 2008 | PinPlot543.jpg (file) | 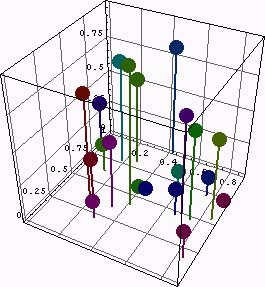 |
45 KB | Scatterplot with thir axis. Created with Mathematica's PinPlot3D command. Taken from "library.wolfram.com". | 1 |
| 22:47, 2 November 2008 | ClustersOutlyers.jpg (file) | 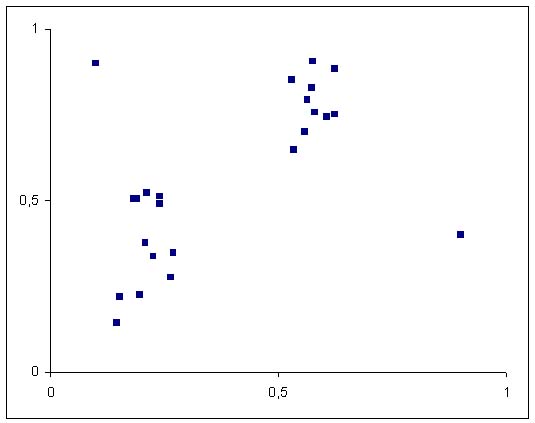 |
24 KB | Scatterplot with two recognizable clusters and outlyers. | 1 |
| 12:28, 2 November 2008 | SomeScatterplots.jpg (file) | 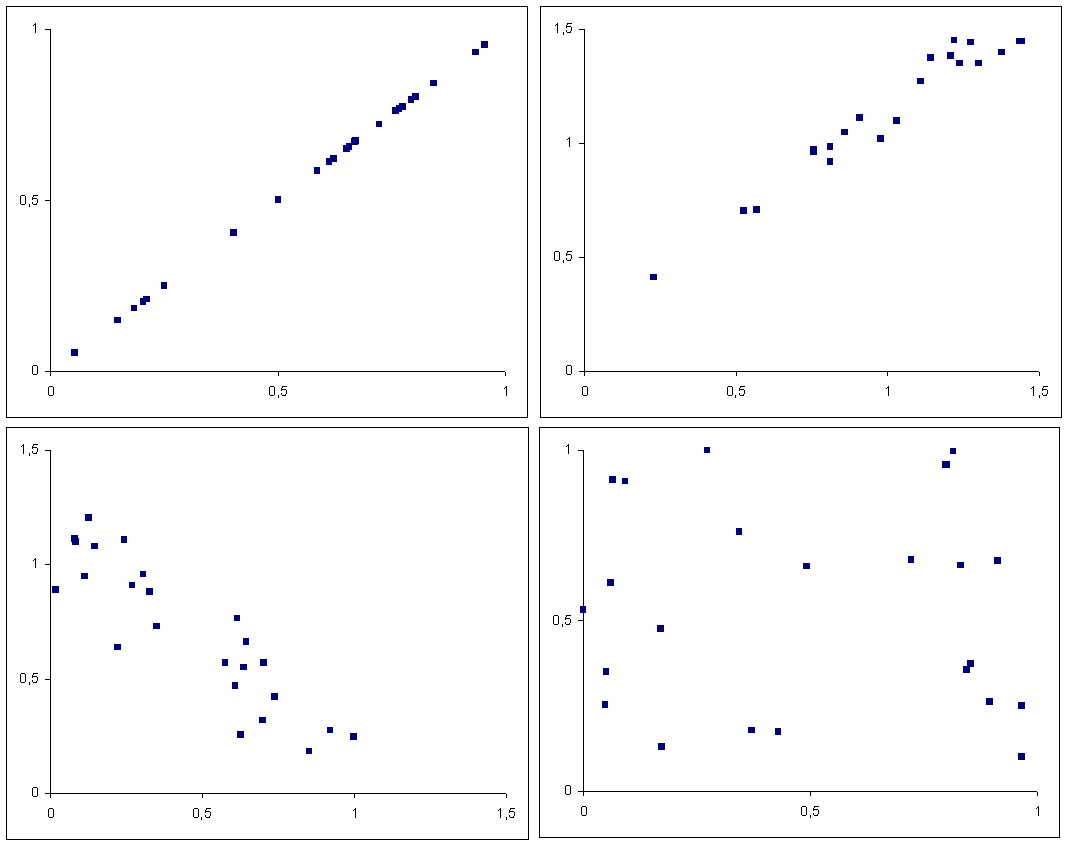 |
63 KB | Some scatterplots: perfect positive, strong positivve, weak negative and one with no corellation among variables. | 1 |
| 12:17, 2 November 2008 | WeakNegativeCorrelationLine.jpg (file) | 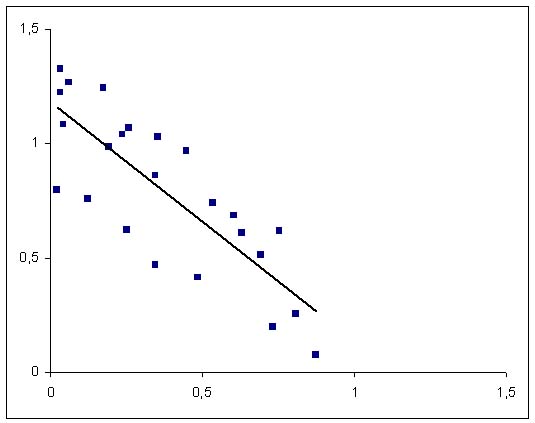 |
28 KB | Scatterplot of two variables with weak negative correlation, featuring regression line. | 1 |
| 12:16, 2 November 2008 | WeakNegativeCorrelation.jpg (file) | 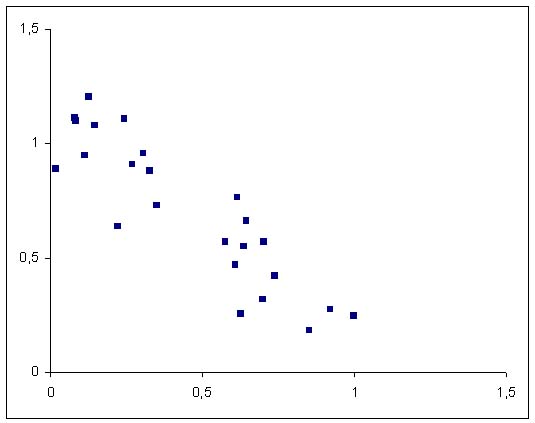 |
24 KB | Scatterplot of two variables with weak negative correlation. | 1 |
| 12:16, 2 November 2008 | StrongPositiveCorrelation.jpg (file) | 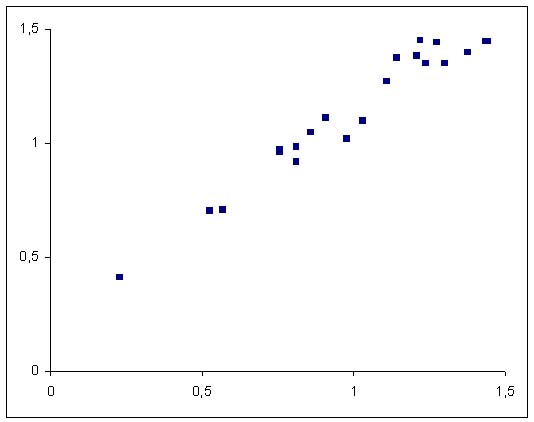 |
24 KB | Scatterplot of two variables with strong positive correlation. | 1 |
| 12:15, 2 November 2008 | PerfectPositiveCorrelation.jpg (file) | 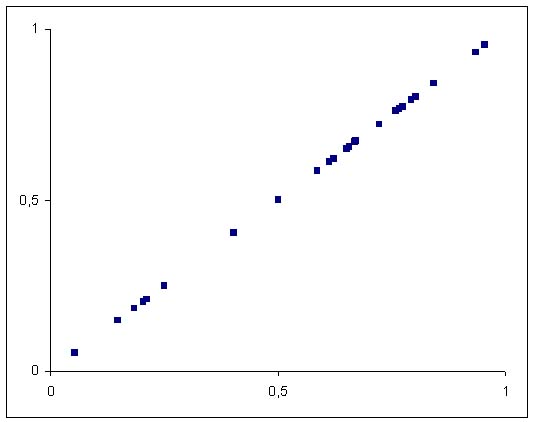 |
23 KB | Scatterplot of two variables with perfectly positive correlation. | 1 |
| 12:14, 2 November 2008 | NoCorrelation.jpg (file) | 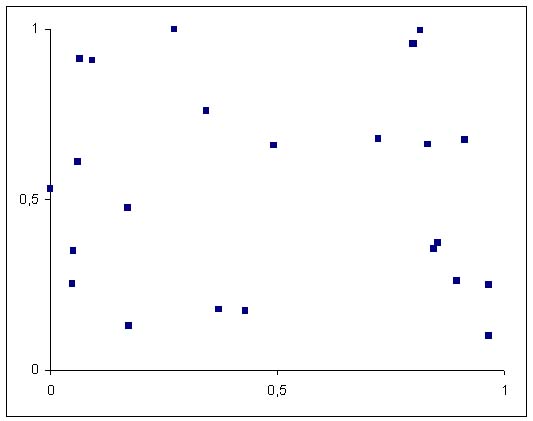 |
24 KB | Scatterplot of uncorrelated variables. | 1 |
| 16:28, 17 October 2008 | Automat05.jpg (file) |  |
26 KB | 1 |