Uploads by UE-InfoVis08-04
Jump to navigation
Jump to search
This special page shows all uploaded files.
| Date | Name | Thumbnail | Size | Description | Versions |
|---|---|---|---|---|---|
| 18:52, 28 April 2008 | Ellegard, Kajsa.jpg (file) |  |
18 KB | Photo from Ellegard, Kasja | 1 |
| 09:18, 23 April 2008 | ResultingTableOfAlg.gif (file) | 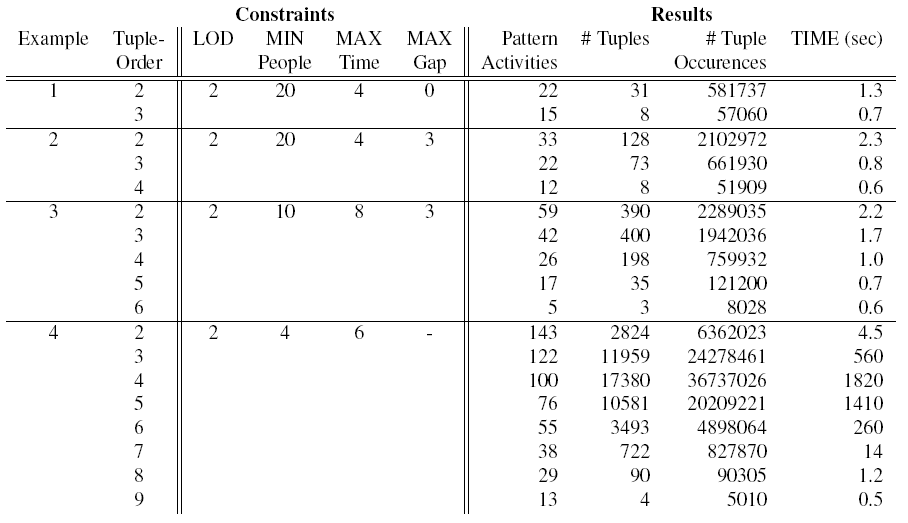 |
22 KB | Table of results from running the algorithm for individuals aged 26 to 46 and testing various constraints. The dataset includes 190 individuals, 7303 activities. The algorithm was run on a standard desktop PC with a 3GHz P4 CPU and 1GB RAM. | 1 |
| 08:36, 23 April 2008 | IdentifiedPatternsOfAlg.gif (file) |  |
29 KB | An example of patterns identified by the algorithm. The triple pattern <prepare food; eat dinner; wash up after dinner>, (a), shows that this pattern is performed mostly by women. It’s subpattern <eat dinner; wash up after dinner>, (b), shows that more | 1 |
| 08:31, 23 April 2008 | TimePAcTSVisualizations.gif (file) | 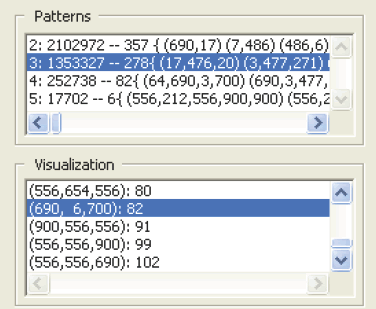 |
20 KB | Results of the pattern identification algorithm as seen in the graphical user interface of the VISUAL-TimePAcTS application. In the figure the 278 identified pattern triples (3 − tuples) are selected and listed. From the pattern list the pattern <‘pre | 1 |
| 08:29, 23 April 2008 | PatternIdentificationAlg.gif (file) | 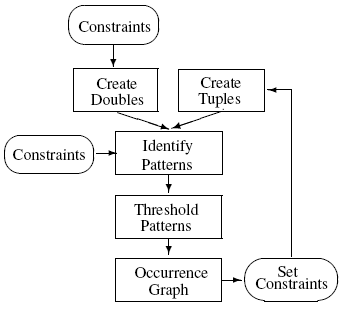 |
6 KB | Overview of the pattern identification algorithm. The algorithm is an adapted AprioriAll algorithm. | 1 |
| 08:28, 23 April 2008 | IndividualsActivityPath.gif (file) | 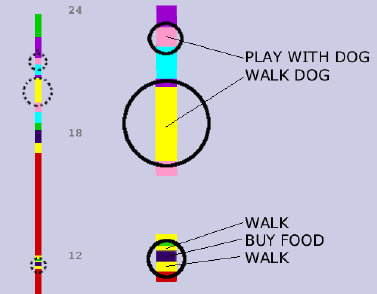 |
8 KB | Visualization of an individual’s activity path showing examples of two pattern types. In the pattern <‘walk’;‘buy food’;‘walk’> the pattern activities occur immediately after each other in the activity path of the individual giving a zero ga | 1 |
| 08:27, 23 April 2008 | TimePAcTSActivityPathes.gif (file) | 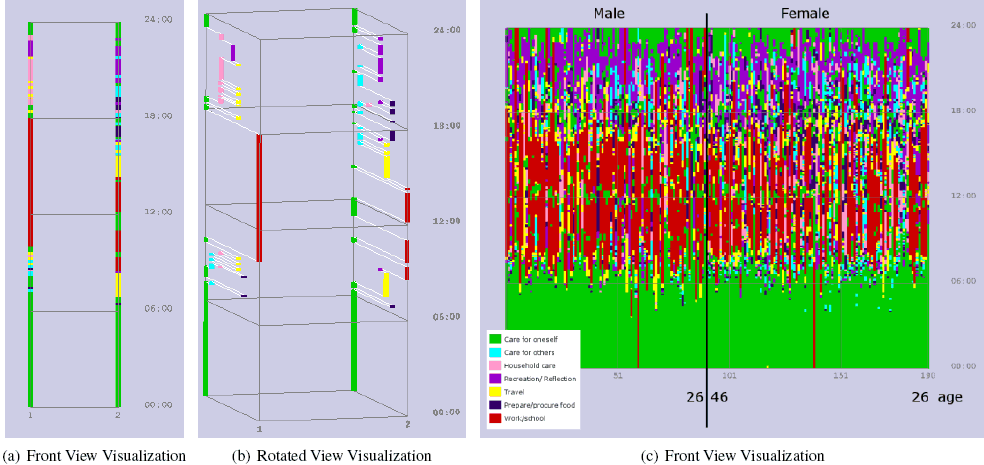 |
78 KB | Visualizations in the Visual-TimePAcTS framework. (a) shows the activity paths of a couple viewed from the front. This view is the ‘real time-use’ representation showing the switch between activities performed during a work day. (b) shows a slightly r | 2 |
| 08:16, 23 April 2008 | RealTimeUseRepresentation.gif (file) | 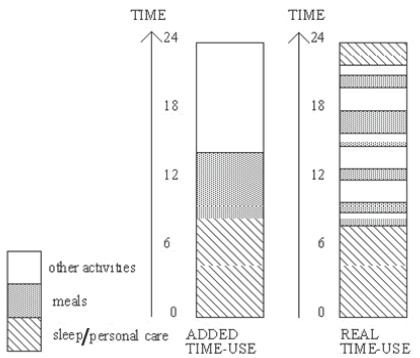 |
29 KB | Traditionally time-use studies use representations that account for the accumulated time used for activities during the day. This ‘added time-use’ representation, seen in the left, hides information that may be important to a social scientist, for exa | 1 |
| 19:33, 22 April 2008 | Space-time path.gif (file) | 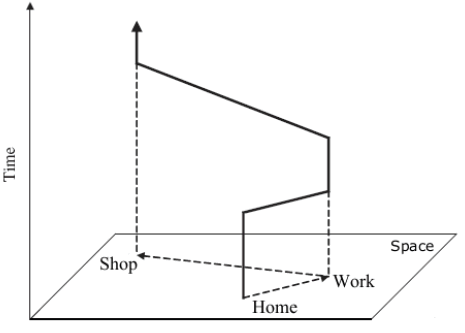 |
8 KB | The original time geographical representation of human space-time behaviour. The, so called, ‘space-time path’is a vertical trajectory representing the movement of an individual in space and time. | 1 |
| 19:23, 22 April 2008 | Figure1.gif (file) |  |
8 KB | The original time geographical representation of human space-time behaviour. The, so called, ‘space-time path’is a vertical trajectory representing the movement of an individual in space and time. | 1 |