Uploads by UE-InfoVis0506 0306110
Jump to navigation
Jump to search
This special page shows all uploaded files.
| Date | Name | Thumbnail | Size | Description | Versions |
|---|---|---|---|---|---|
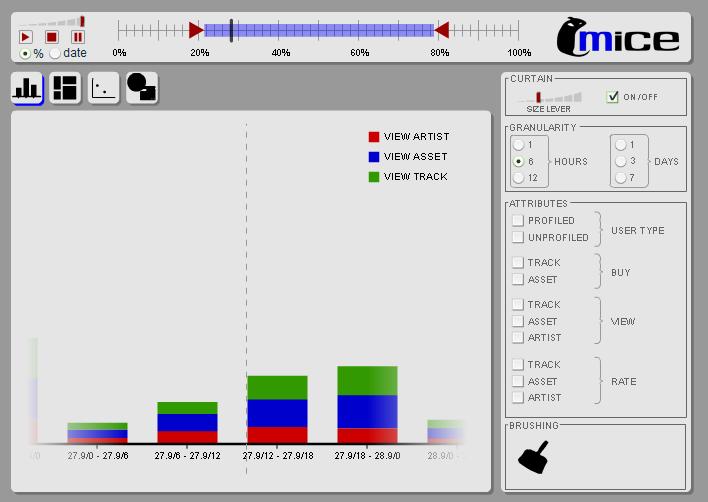
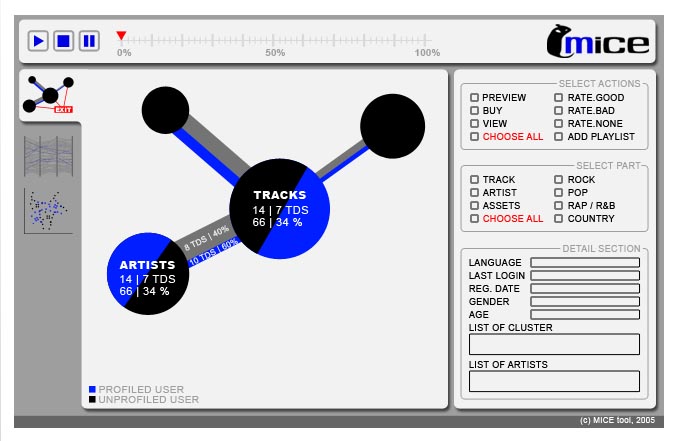
| 18:00, 20 December 2005 | Screenshot 2.jpg (file) |  |
40 KB | Screenshot of MICE Tool. | 1 |
| 17:55, 20 December 2005 | Screenshot 2.JPG (file) |  |
40 KB | Screenshot of MICE Tool with Barchart in the picture. | 1 |
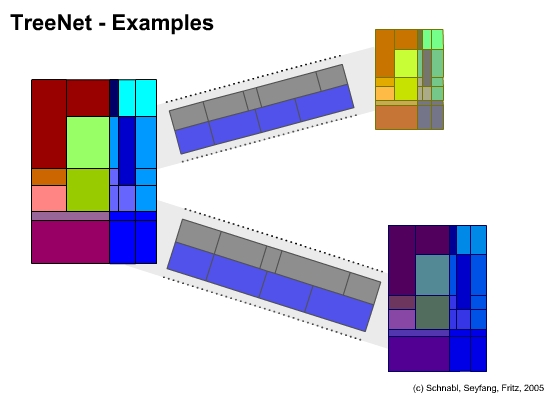
| 19:01, 26 November 2005 | TreeNetFull.jpg (file) |  |
62 KB | Example for a possible TreeNet. | 1 |
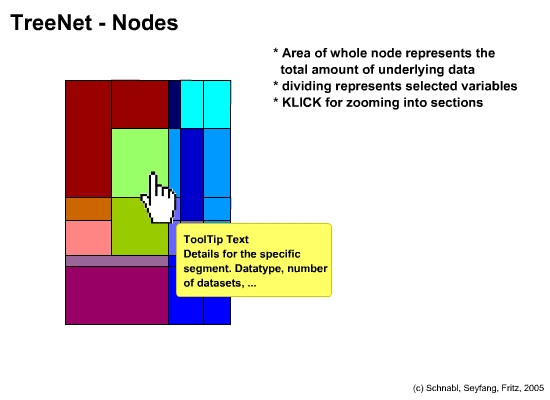
| 19:00, 26 November 2005 | TreeNetSchema.jpg (file) |  |
58 KB | Schema of the TreeNet technique for database structured data. | 1 |
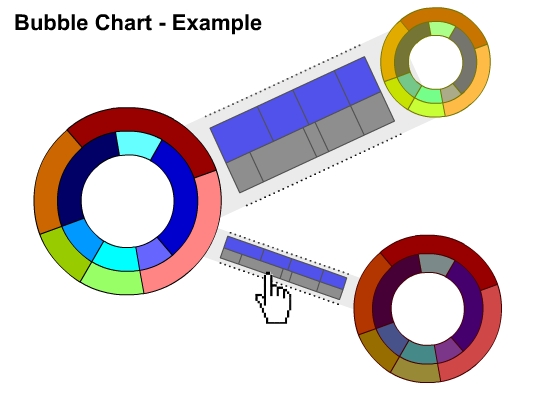
| 18:49, 26 November 2005 | BubbleSchemaFull.jpg (file) |  |
87 KB | Full example of the Bubble Chart technique. | 1 |
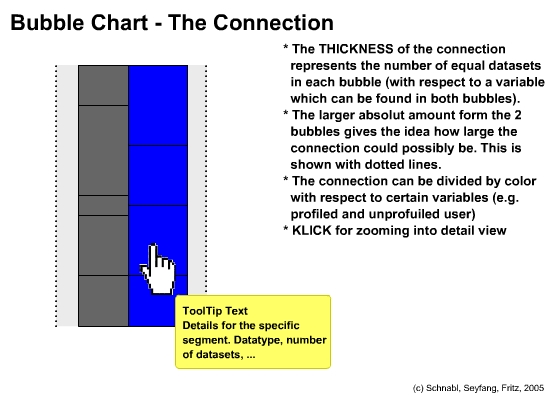
| 18:43, 26 November 2005 | BubbleConnSchema.jpg (file) |  |
101 KB | Schema of the connection parts of the Bubble Chart technique. | 1 |
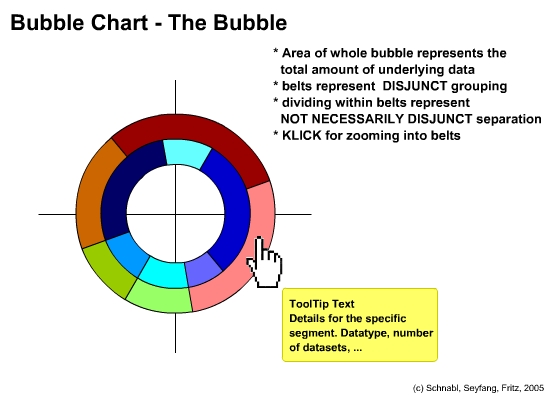
| 18:42, 26 November 2005 | BubbleSchema.jpg (file) |  |
86 KB | Schema of the Bubble Chart technique for visualizing datastructures modelled with ER diagramms. | 1 |
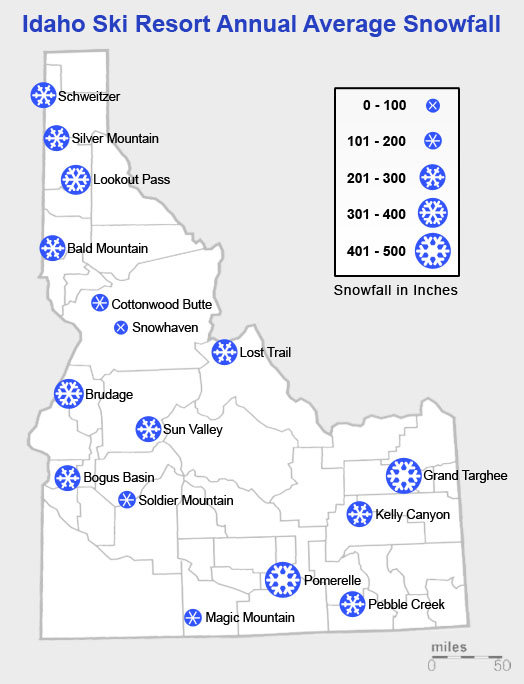
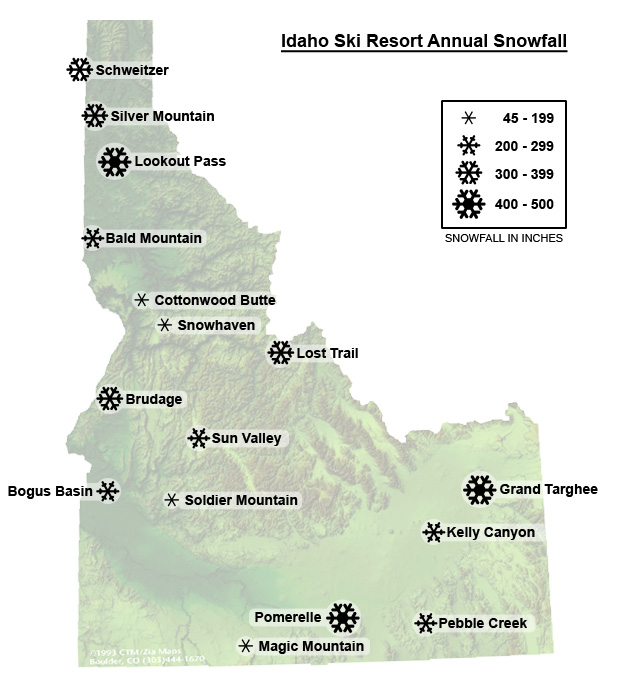
| 22:50, 25 November 2005 | SnowfallIdaho9.jpg (file) |  |
108 KB | Snowfall values in Idaho, annual average. | 4 |
| 21:54, 19 November 2005 | Screenshot2 small.jpg (file) |  |
82 KB | Showing a mockup of the possible lookalike of prototype. | 1 |
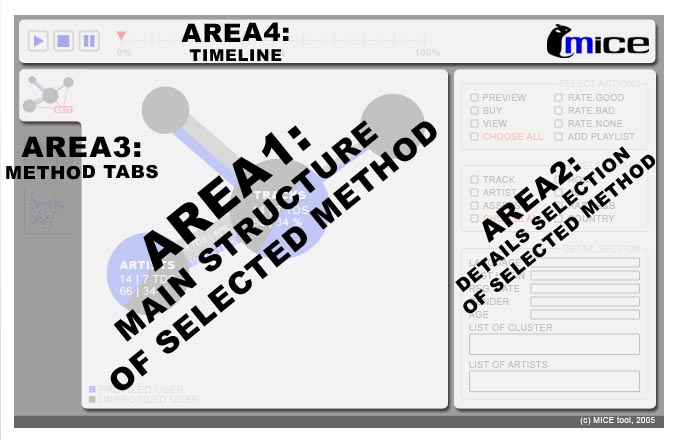
| 21:53, 19 November 2005 | Screenshot2 structure.jpg (file) |  |
85 KB | Giving the basic structure for the prototype for a visualization applet for online music portal data. | 1 |
| 18:29, 12 November 2005 | MICELogo.gif (file) |  |
6 KB | Logo of MICE - Tool for Exploratory data analysis of music portal usage data. | 1 |
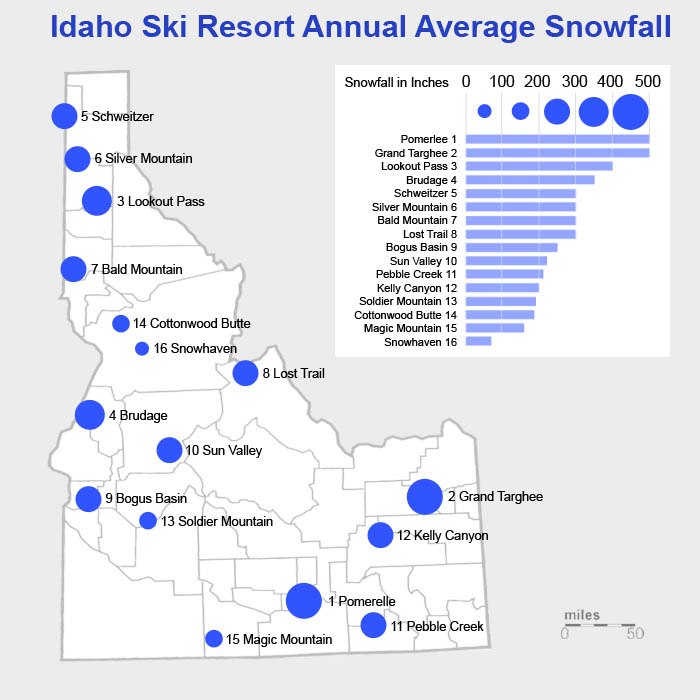
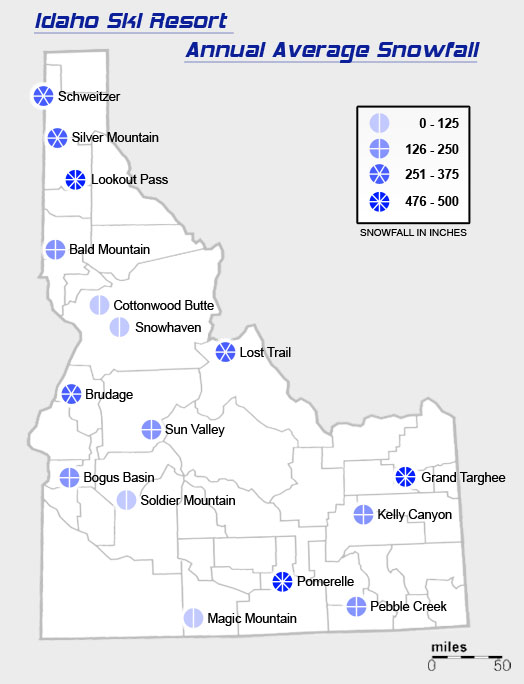
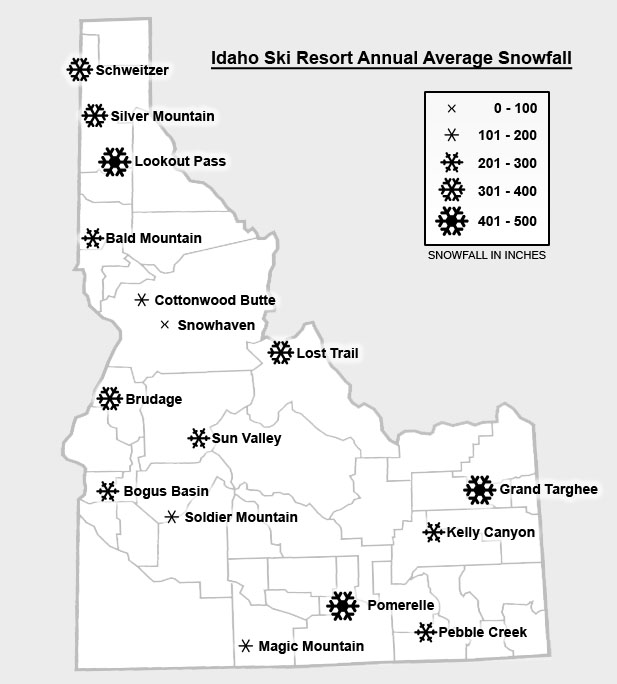
| 14:42, 3 November 2005 | SnowfallIdaho7.jpg (file) |  |
98 KB | Corrected Graphic fo the average annual snowfall in Idaho according to design principles. | 1 |
| 20:03, 1 November 2005 | SnowfallIdaho6.jpg (file) |  |
89 KB | 1 | |
| 19:46, 1 November 2005 | SnowfallIdaho5.jpg (file) |  |
90 KB | 1 | |
| 19:43, 1 November 2005 | SnowfallIdaho4.jpg (file) |  |
94 KB | 1 | |
| 11:56, 1 November 2005 | SnowfallIdaho3.jpg (file) |  |
93 KB | 2 | |
| 19:38, 28 October 2005 | Proportion.gif (file) |  |
11 KB | Giving an easy example why the actually visible areas in a 3D bar chart are not proportional to the represented values. | 1 |
| 18:40, 28 October 2005 | Junk1.gif (file) |  |
9 KB | A foil out of a presentatioin by MAGGIE ELGIN, Ph.D from the University of Maryland. | 1 |
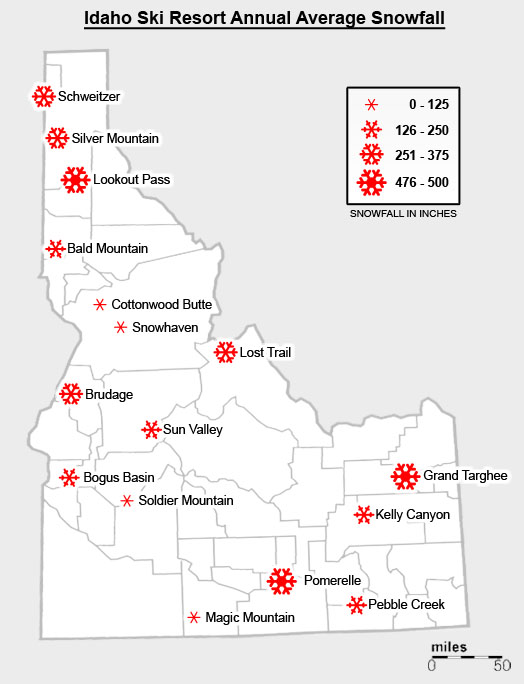
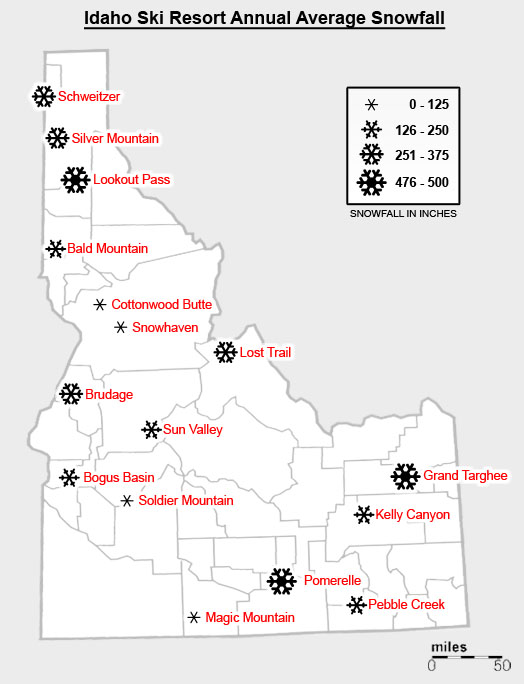
| 20:33, 25 October 2005 | SnowfallIdaho.jpg (file) |  |
139 KB | Worked image of Snowfall Values in Idaho | 1 |
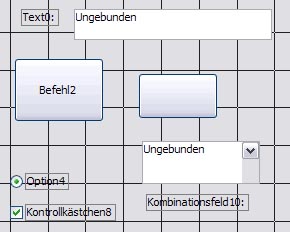
| 19:35, 25 October 2005 | VBAObjekte.jpg (file) |  |
47 KB | Screenshot of the object palette from Microsoft Access 2003. | 1 |
| 12:30, 23 October 2005 | Header.gif (file) | 4 KB | A website header providing consistency in ist used elements. | 1 | |
| 12:30, 23 October 2005 | Structure.gif (file) |  |
3 KB | Showing an example structuring providing basic consistency. | 1 |
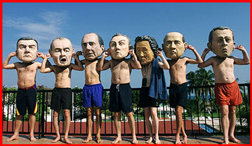
| 18:32, 18 October 2005 | Leaders.jpg (file) |  |
51 KB | 1 | |
| 18:26, 18 October 2005 | Eyes.gif (file) |  |
21 KB | 1 |