Uploads by Iwolf
Jump to navigation
Jump to search
This special page shows all uploaded files.
| Date | Name | Thumbnail | Size | Description | Versions |
|---|---|---|---|---|---|
| 13:01, 12 June 2012 | Oreilly 2012 datajournalismhandbook.png (file) |  |
139 KB | Book cover of Gray, J. and Chambers, L. and Bounegru, L., The Data Journalism Handbook, O'Reilly Media, 2012 | 1 |
| 13:49, 10 April 2012 | Flowingdata2012visualizethis.png (file) |  |
111 KB | [FlowingData, 2012] Nathan Yau, FlowingData, Retrieved at: April 10, 2012. http://book.flowingdata.com/ | 1 |
| 18:27, 2 March 2012 | Beautiful-visualization.jpg (file) |  |
164 KB | Book Cover "Beautiful Visualization" | 1 |
| 08:40, 19 October 2010 | Akpeters10idvbook.jpg (file) |  |
3 KB | Book Cover of Ward, M. and Grinstein, G. and Keim, D.: Interactive Data Visualization: Foundations, Techniques, and Application | 1 |
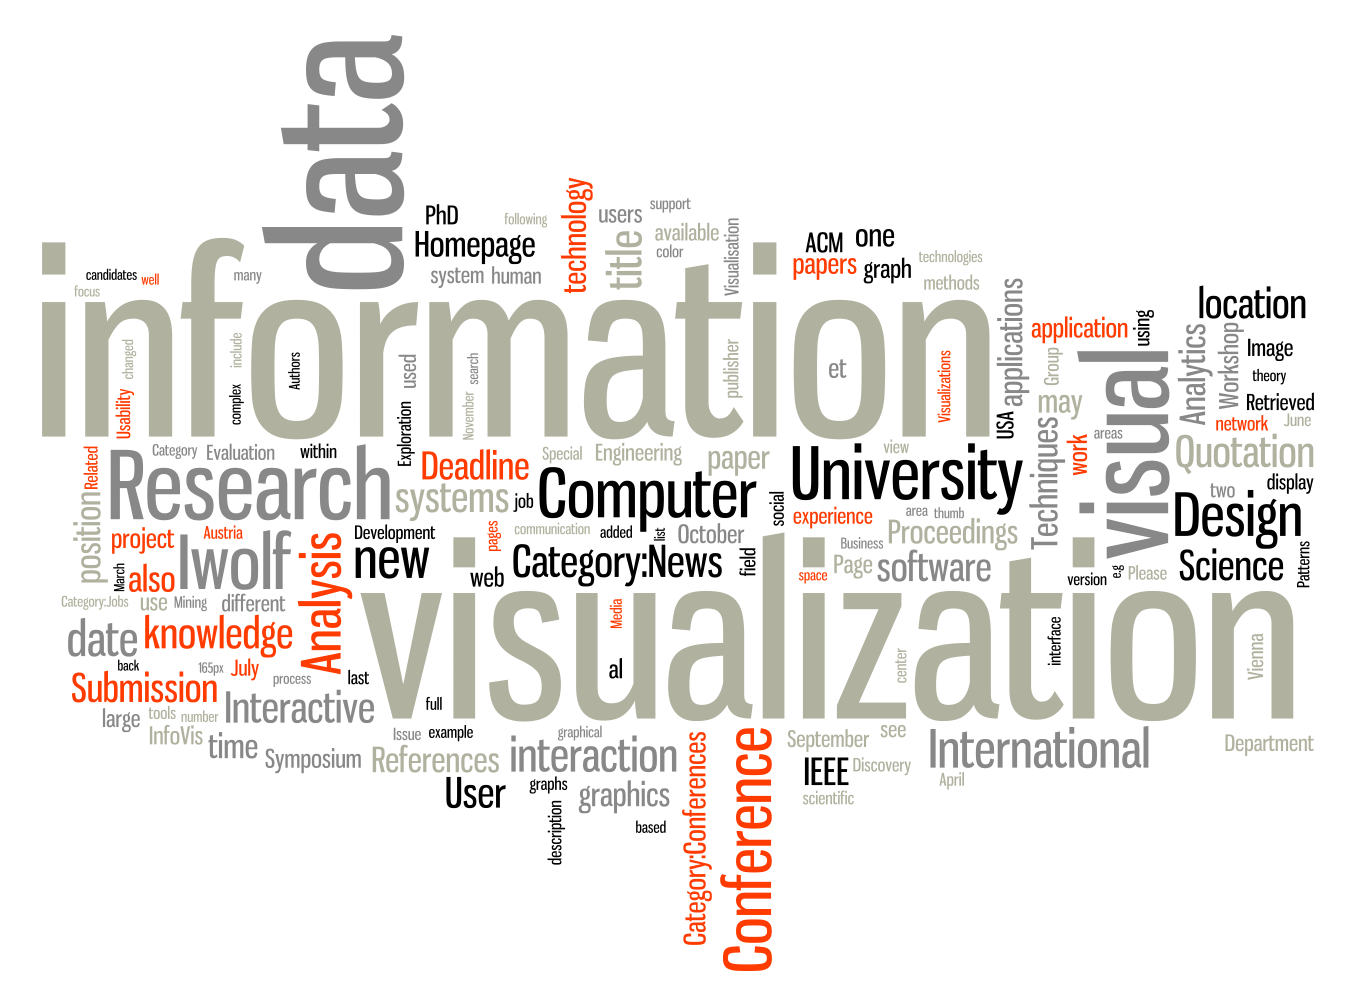
| 14:37, 27 August 2009 | Infovis-wiki tagcloud 20090827.png (file) |  |
291 KB | Wordle generated Tag Cloud of InfoVis Wiki content | 2 |
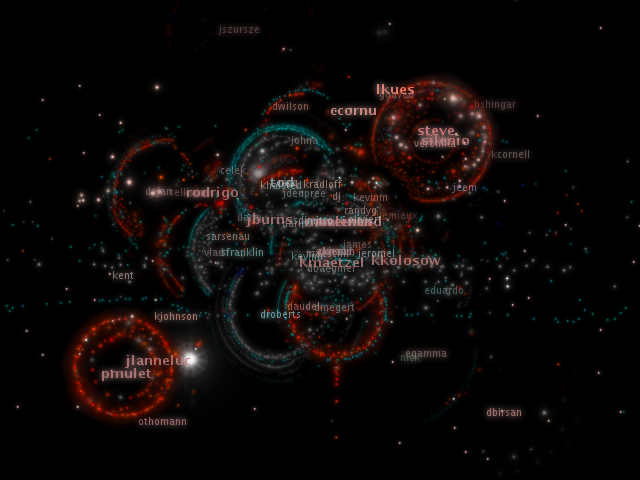
| 08:33, 26 August 2008 | Ogawa08codeswarm.png (file) |  |
218 KB | code_swarm - Organic software visualization | 1 |
| 07:59, 29 July 2008 | Elsevier08ware-visual-thinking.jpg (file) |  |
323 KB | Book Cover "Visual Thinking for Design - Colin Ware" | 1 |
| 11:05, 3 July 2008 | Ivda fish-image web.jpg (file) |  |
20 KB | Goldfish jump | 1 |
| 09:39, 6 February 2008 | Springer08information-retrieval.JPG (file) |  |
6 KB | Book "Zhang, J.: Visualization for Information Retrieval, Springer, 2008" | 1 |
| 09:31, 5 December 2007 | Heer07flare.png (file) |  |
47 KB | Example of [http://flare.prefuse.org/ the flare visualization toolkit] | 1 |
| 09:18, 9 October 2007 | Fayyad96kdd-process.png (file) |  |
83 KB | An Overview of the Steps That Compose the KDD Process | 1 |
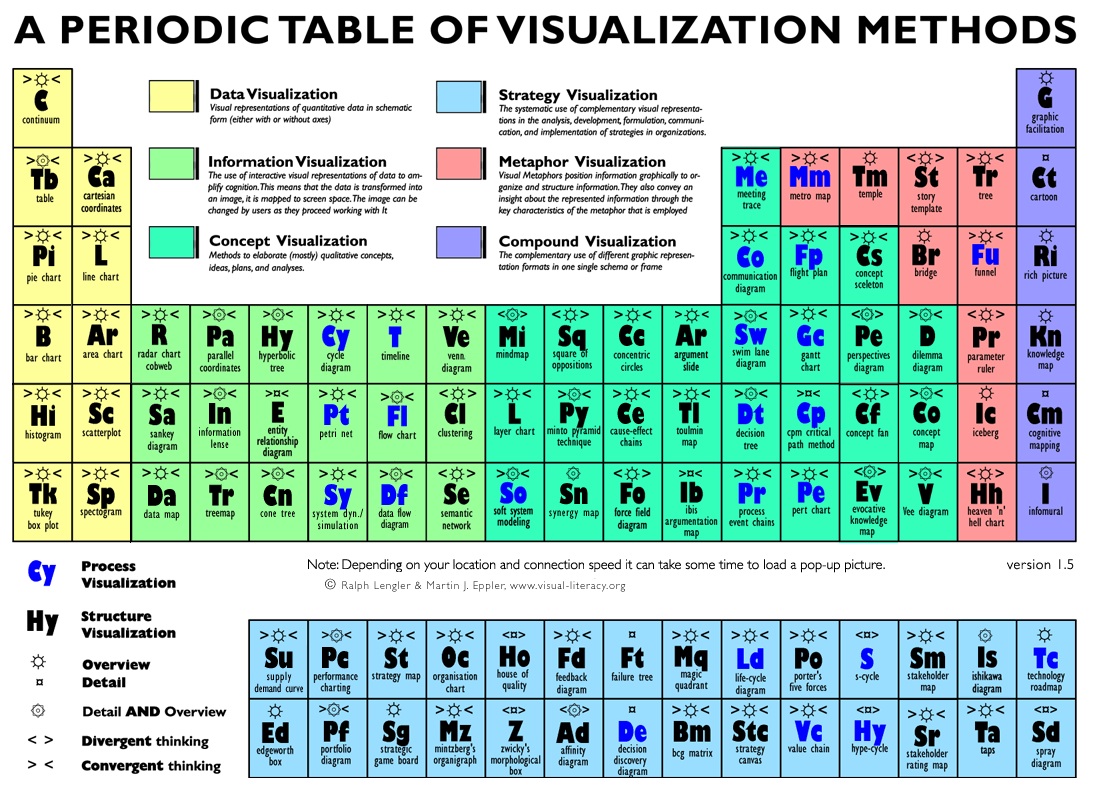
| 12:27, 1 March 2007 | Lengler07periodic-table.jpg (file) |  |
375 KB | A Periodic Table of Visualization Methods ([http://www.visual-literacy.org/periodic_table/periodic_table.html# interactive version]) | 1 |
| 14:32, 19 February 2007 | Many-eyes07screenshot graph.gif (file) |  |
25 KB | Example of "Many Eyes" visualizaing social network data. | 1 |
| 14:27, 19 February 2007 | Manyeyes07logo.jpg (file) |  |
22 KB | Logo of "Many Eyes" | 1 |
| 13:55, 15 February 2007 | Engelhardt07infovis-diagram.gif (file) |  |
132 KB | The Infovis diagram. | 1 |
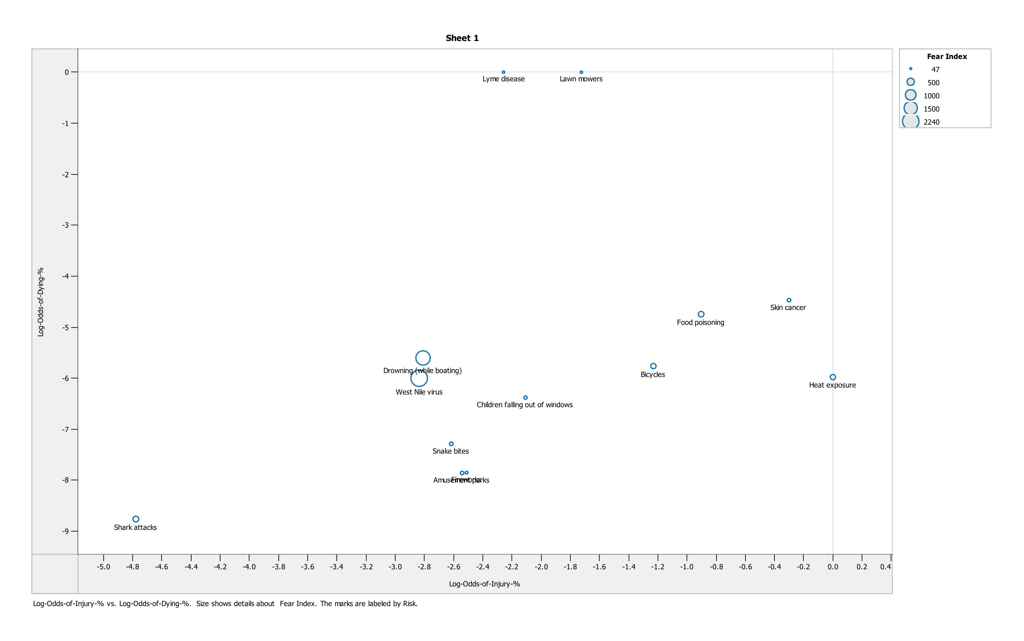
| 12:53, 22 January 2007 | More-risk-less-fear small.jpg (file) |  |
77 KB | More Risk, Less Fear - improved graphic | 1 |
| 16:05, 4 December 2006 | Prefuse-tutorial-20061127-handout.pdf (file) | 658 KB | prefuse Tutorial by Wolfgang Aigner | 1 | |
| 15:32, 4 December 2006 | Aigner 2006 wikiposium infovis-wiki.pdf (file) | 1.93 MB | Slides of InfoVis:Wiki presentation at Wikiposium 2006 | 1 | |
| 10:51, 4 December 2006 | Spence 2006 information-visualization.jpg (file) |  |
85 KB | Book cover of Spence, R.: Information Visualization - Design for Interaction (2nd Edition), Pearson Education, 2006 | 1 |
| 14:41, 29 November 2006 | Beautiful-evidence.jpg (file) |  |
48 KB | Book Cover of Tufte, E.R.: Beautiful Evidence, Graphics Press, 2006 | 1 |
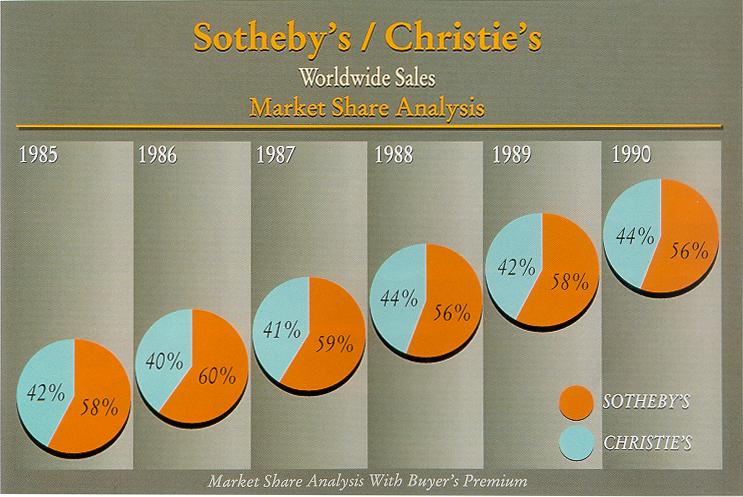
| 08:54, 24 October 2006 | Friendly00sothebys.jpg (file) |  |
57 KB | Sotheby's / Christie's Worldwide Sales Market Share Analysis | 1 |
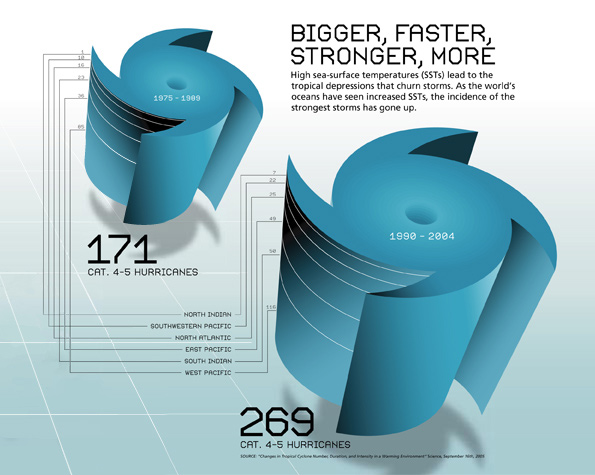
| 08:54, 24 October 2006 | Seed06storms.jpg (file) |  |
85 KB | State of the Planet - Bigger, Faster, Stronger, More | 1 |
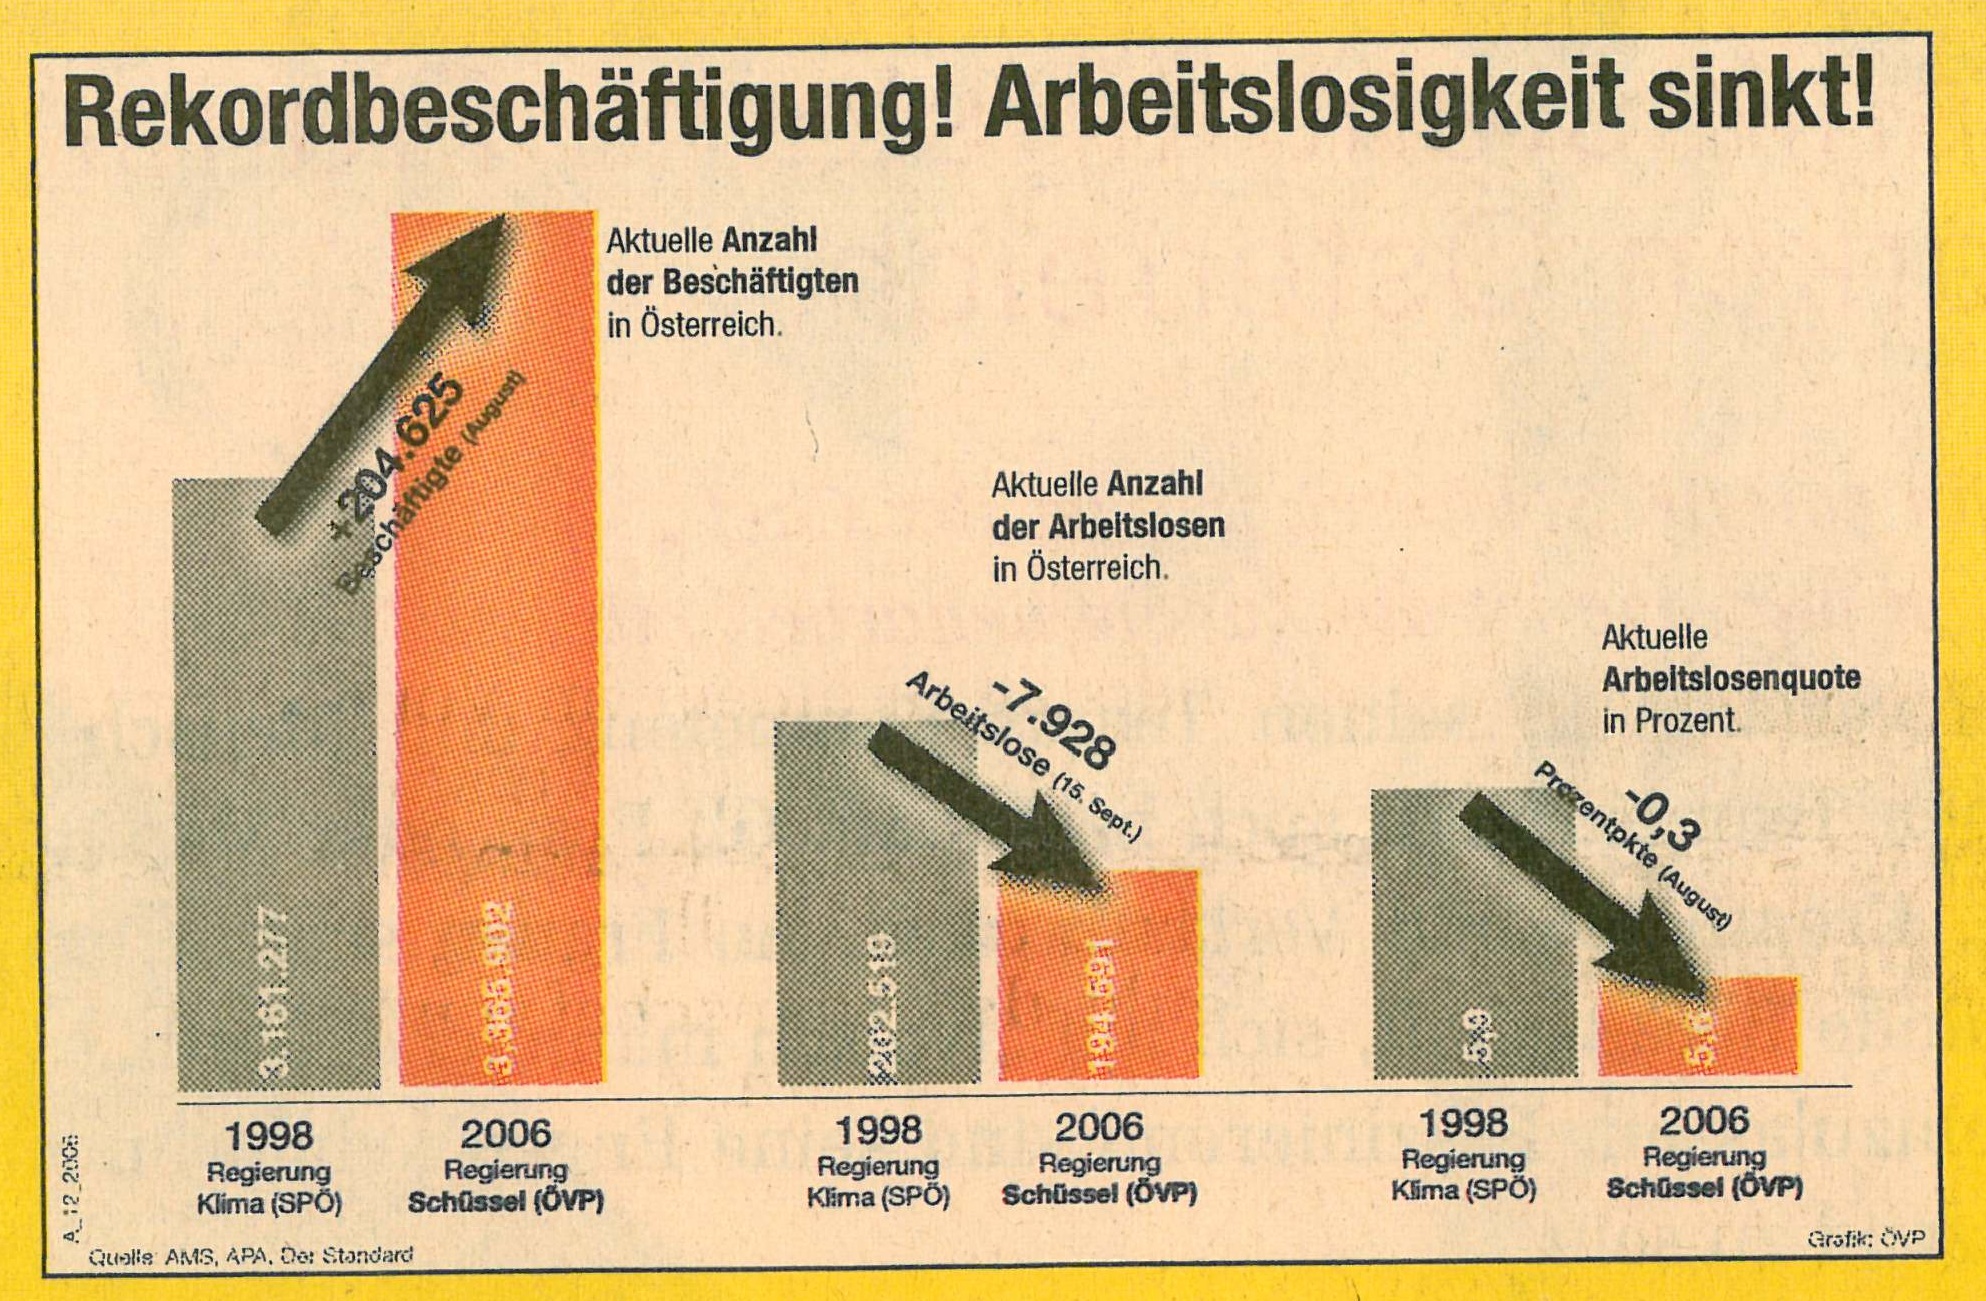
| 08:53, 24 October 2006 | Derstandard06rekordbeschaeftigung.jpg (file) |  |
821 KB | Rekordbeschäftigung! Arbeitslosigkeit sinkt! | 1 |
| 14:37, 19 October 2006 | Duk-logo 250x250.png (file) | 5 KB | Logo of Danube University Krems | 1 | |
| 14:05, 19 October 2006 | Ike-logo-schrift 385x35.png (file) | 8 KB | IKE Logo Department of Information and Knowledge Engineering, Danube University Krems | 1 | |
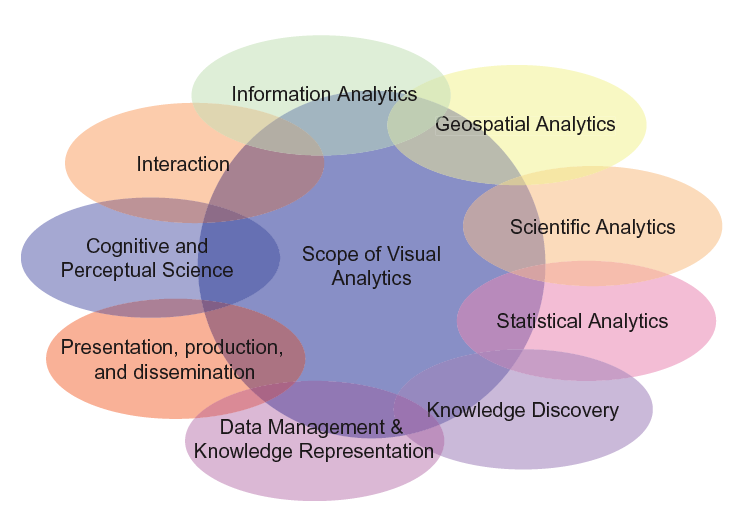
| 10:04, 31 August 2006 | Keim06visual-analytics-disciplines.png (file) |  |
61 KB | Visual analytics as a highly interdisciplinary field of research. | 1 |
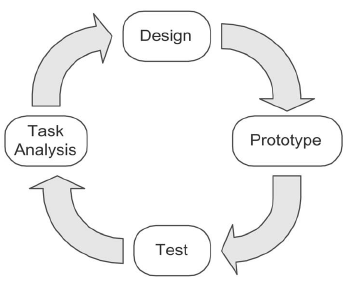
| 09:05, 7 June 2006 | Tory04user-centered-design.png (file) |  |
32 KB | Design cycle | 1 |
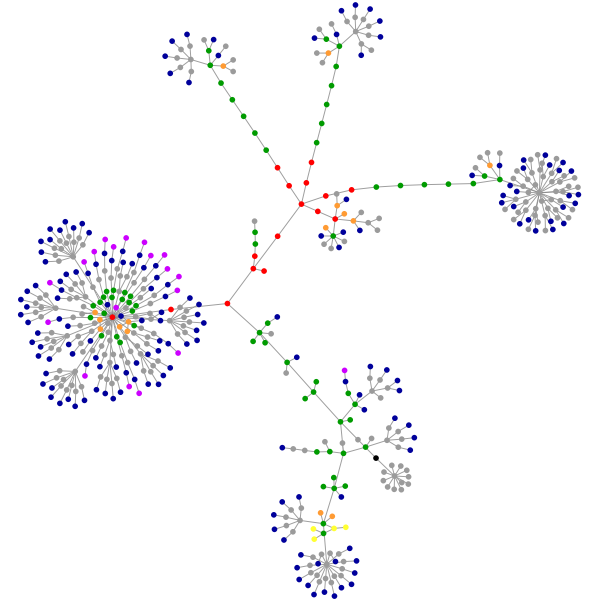
| 09:57, 29 May 2006 | Aharef06websitegraph.png (file) |  |
95 KB | Websites as graphs (http://www.infovis-wiki.net) | 1 |
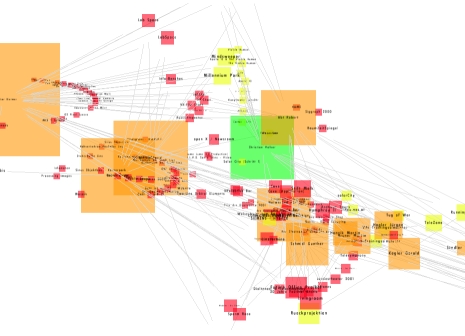
| 09:38, 24 May 2006 | Offenhuber06semaspace.jpg (file) |  |
74 KB | SemaSpace is a fast and easy to use graph editor for large knowledge networks, specially designed for the application in non technical sciences and the arts. It creates interactive graph layouts in 2d and 3d by means of a flexible algorithm. The system is | 1 |
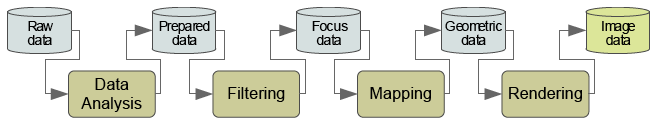
| 12:36, 8 May 2006 | Dossantos04vis pipeline.png (file) | 15 KB | The visualization pipeline describes the process of creating visual representations of data. | 1 | |
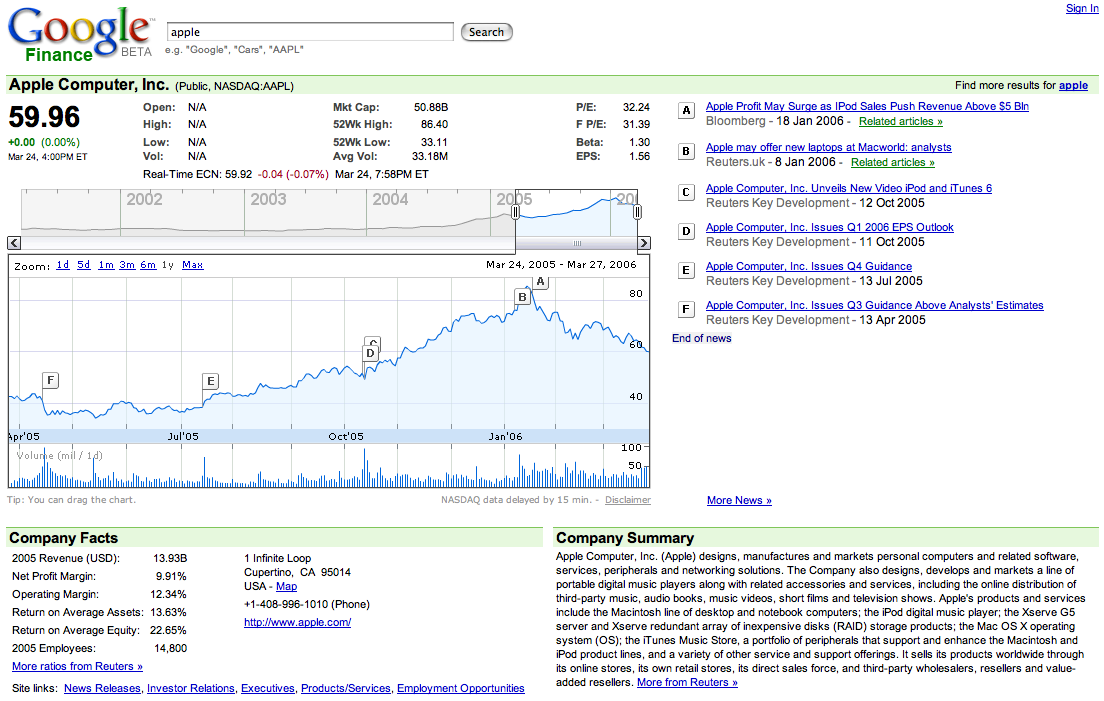
| 08:53, 27 March 2006 | Google06finance.png (file) |  |
170 KB | Interactive Flash graphs to explore stock price data from Google Finance. | 1 |
| 07:41, 27 March 2006 | Smartmoney06marketradar.gif (file) |  |
109 KB | Interactive data visualization of historical stock prices | 1 |
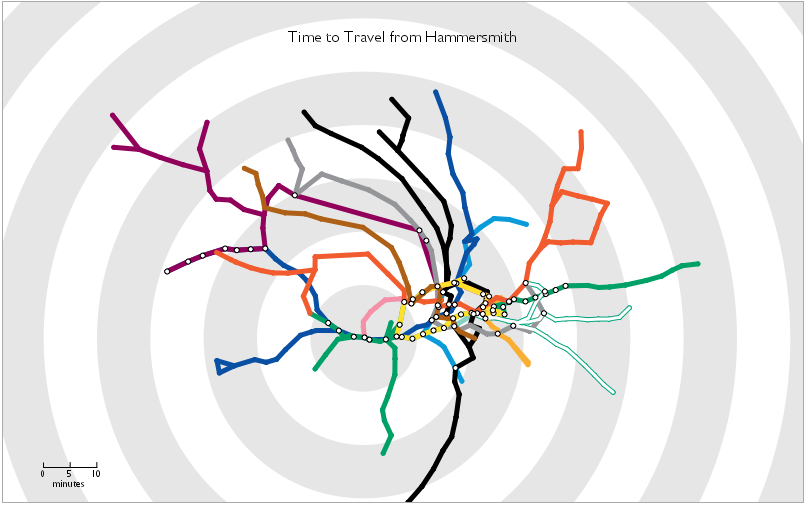
| 15:51, 25 January 2006 | Carden06travel time tube map.png (file) |  |
97 KB | Travel Time Tube Map - Screenshot of an [http://www.processing.org processing] Applet that distorts the London underground network circularly according to travel times from a selected station. | 1 |
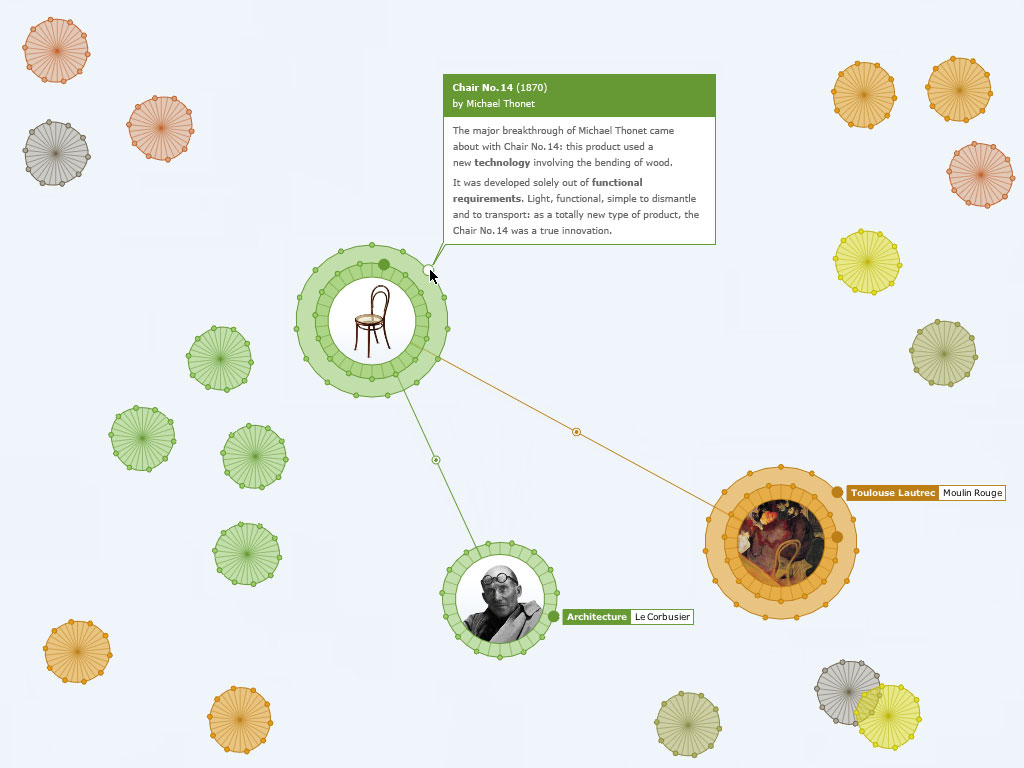
| 13:05, 29 November 2005 | Horn05jellyfish.jpg (file) |  |
92 KB | Jellyfish visualizes an encyclopedia of the arts. The application is developed in Processing and uses an XML-database to update content. | 1 |
| 09:46, 25 November 2005 | Tufte-bar chart-redesign.gif (file) |  |
95 KB | E. Tufte's bar chart redesign | 1 |
| 07:47, 25 October 2005 | Friendly02doctors.gif (file) |  |
10 KB | Bar Chart of "Incomes of Doctors Vs. Other Professionals" | 1 |
| 07:46, 25 October 2005 | Few04tracking-trends.gif (file) | 116 KB | Infographic "Tracking the Trends" | 1 | |
| 07:45, 25 October 2005 | Few05snowfall.gif (file) |  |
67 KB | Map of Idaho Ski Resort Annual Snowfall | 1 |
| 07:44, 25 October 2005 | Perceptualedge03world-car-production.gif (file) |  |
67 KB | Multiple 3D Pie Chart of World Car Production 1977-80 | 1 |
| 07:43, 25 October 2005 | Perceptualedge03slicerdicer.gif (file) |  |
18 KB | Bar Chart of SlicerDicer's Sales Compared to Other Products | 1 |
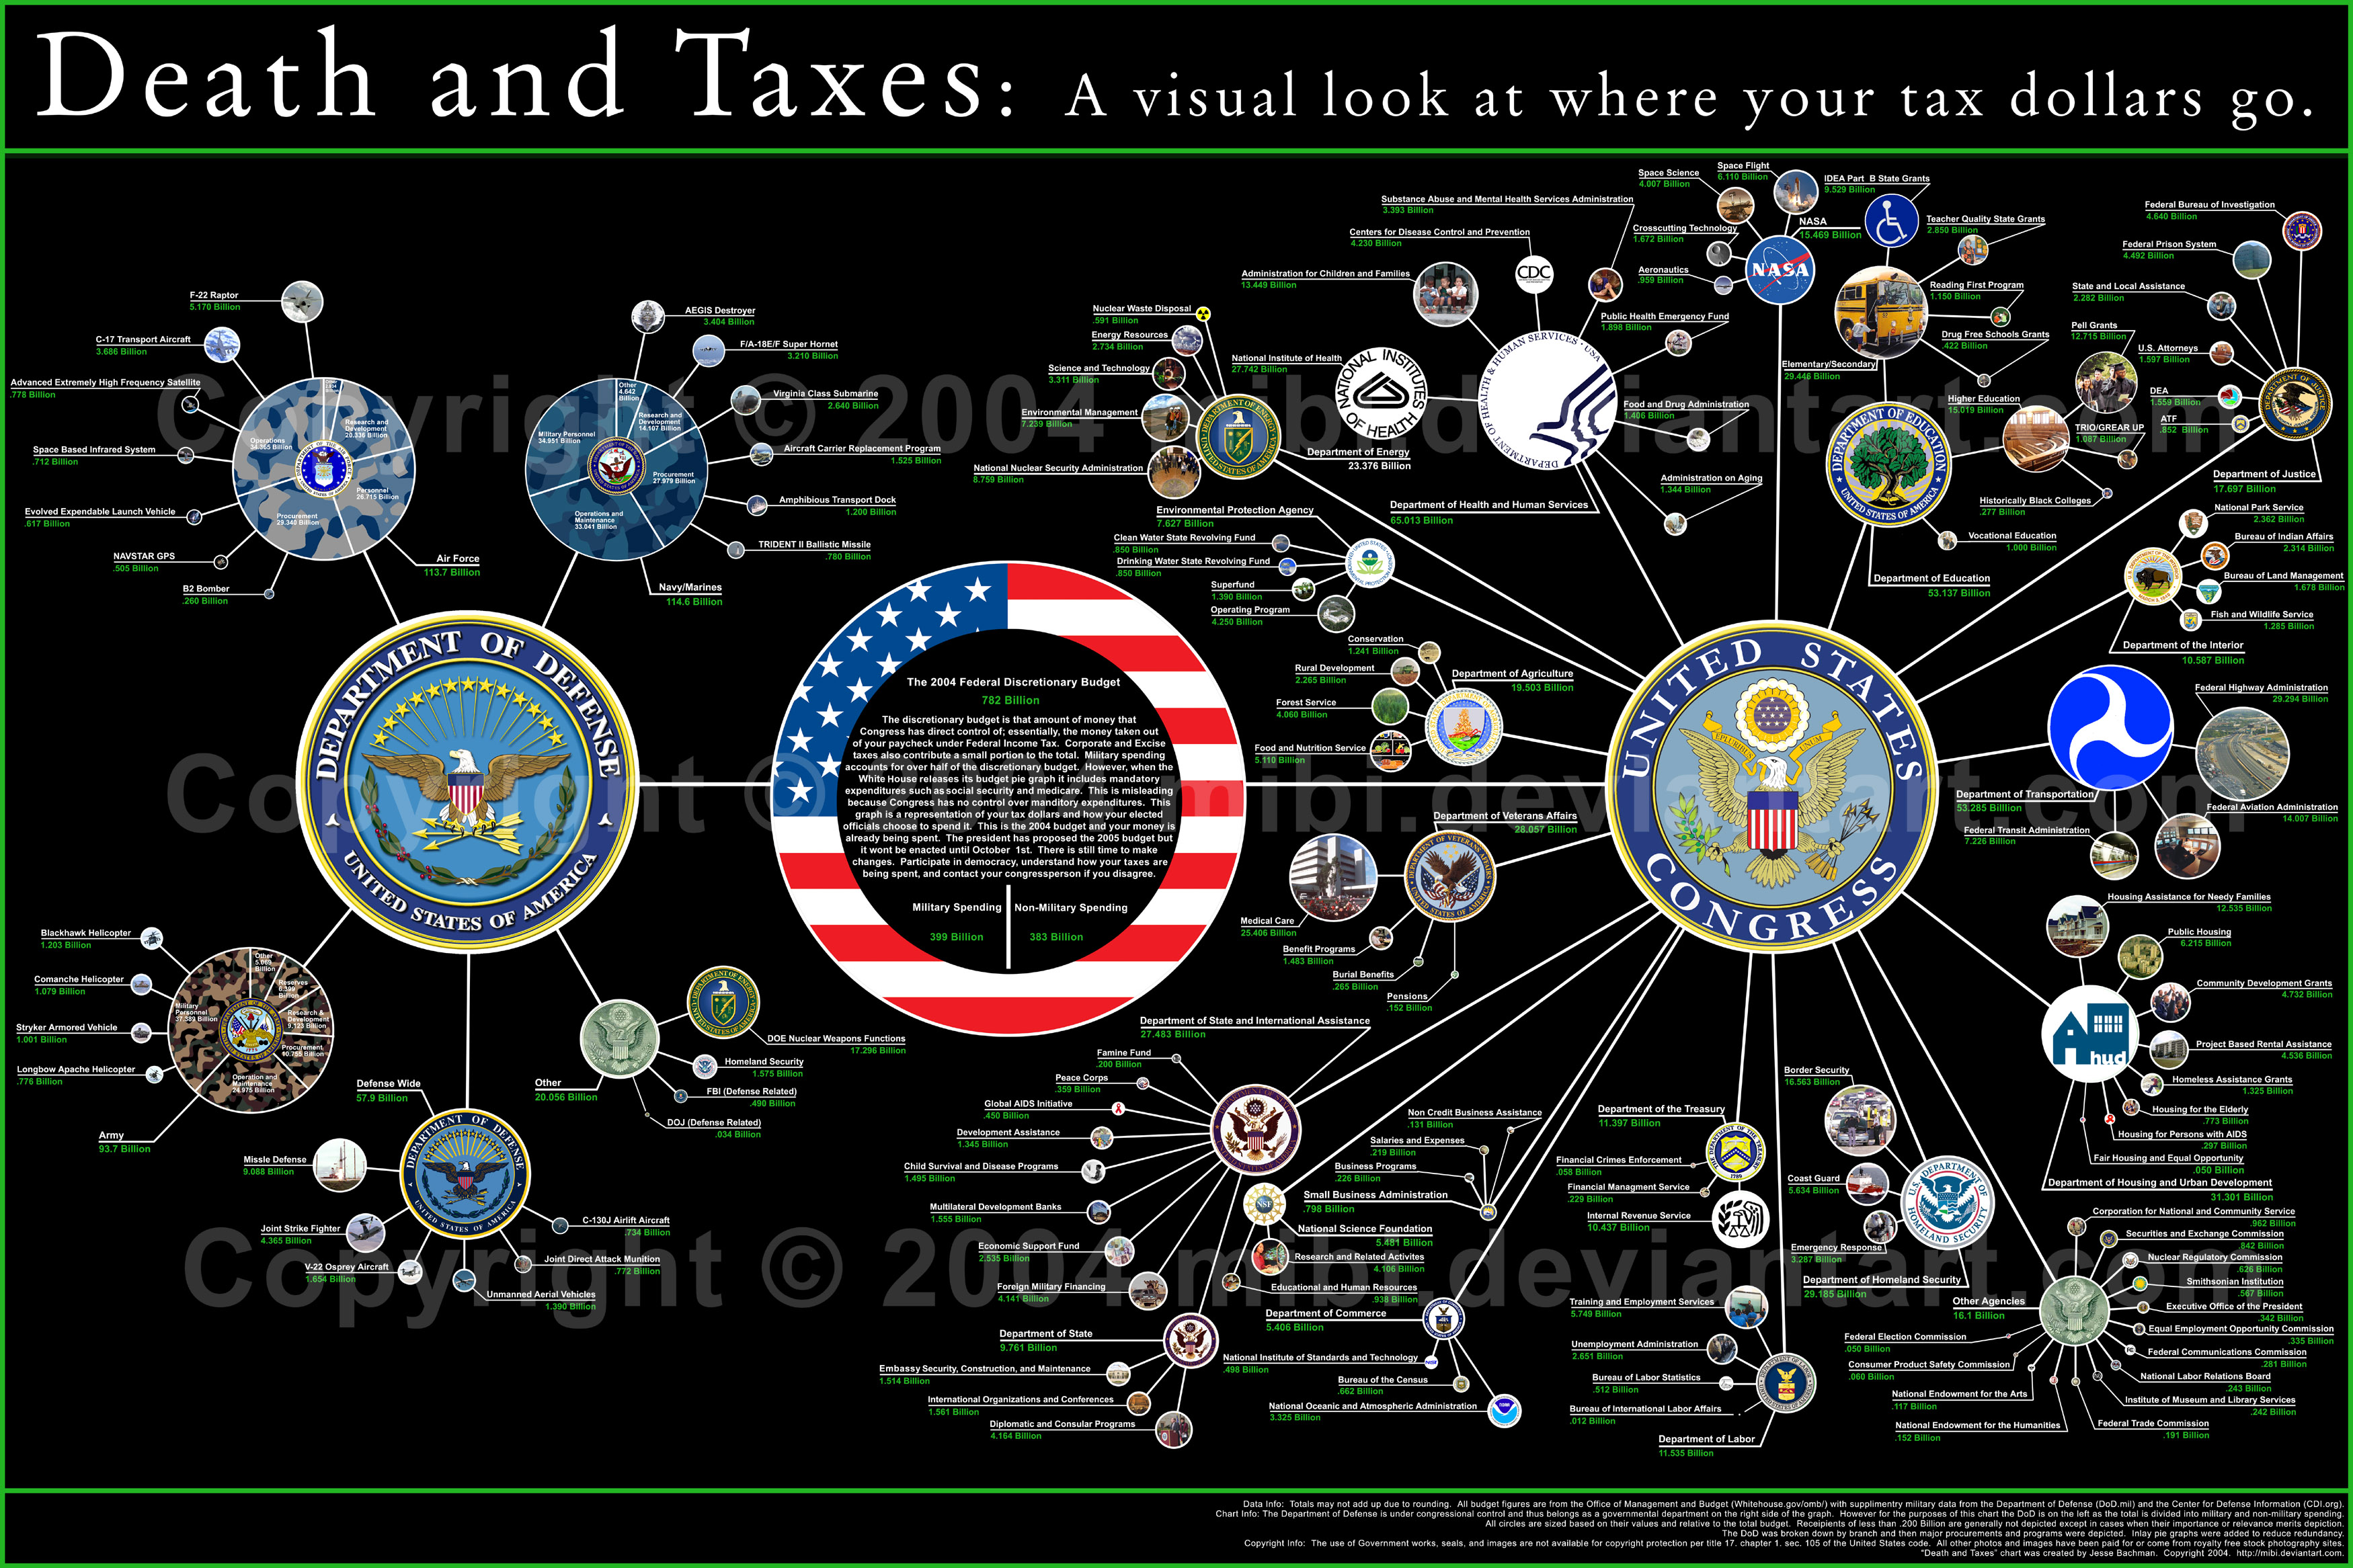
| 07:42, 25 October 2005 | Mibi04death-and-taxes.jpg (file) |  |
1.76 MB | Death and Taxes: A visual look at where your tax dollars go. {{Quotation|Most people are unaware of how much of their taxes fund our military, and those aware are often misinformed. Well here it is. Laid out, easy to read and compare. With data straight | 1 |
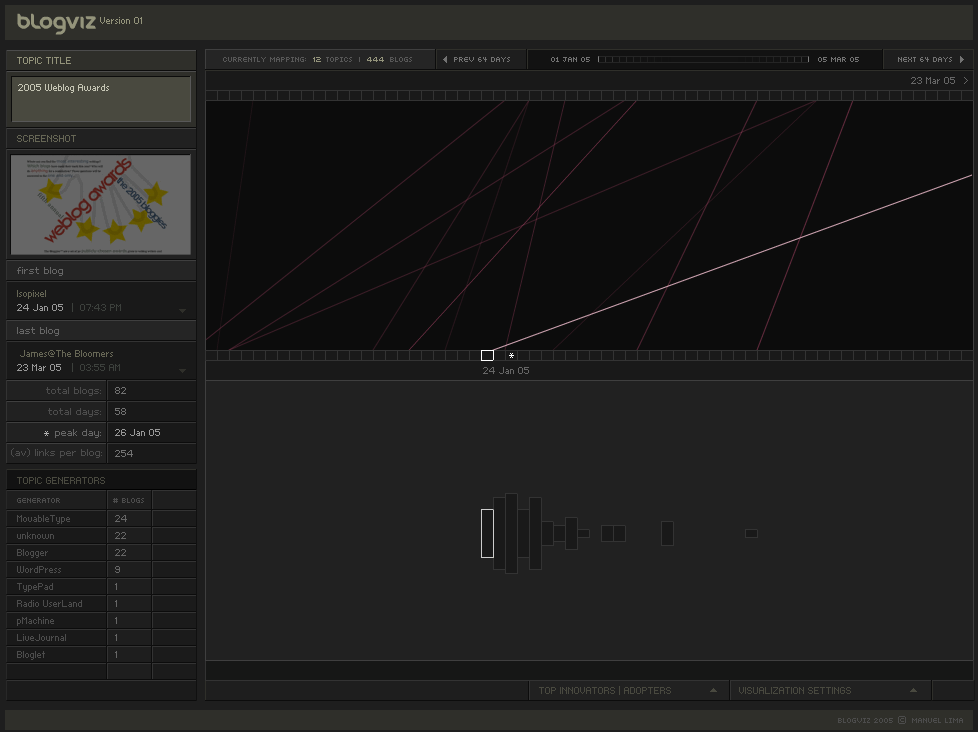
| 12:45, 18 October 2005 | Lima05blogviz.png (file) |  |
24 KB | blogviz - Mapping the dynamics of Information Diffusion in Blogspace | 1 |
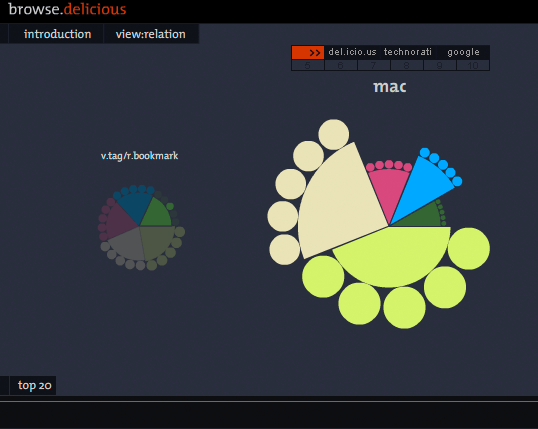
| 10:31, 17 October 2005 | Kormann05browsedelicious.png (file) |  |
52 KB | browse.delicious a visual browser to explore and experience the del.icio.us community network [Kormann, 2005] | 1 |
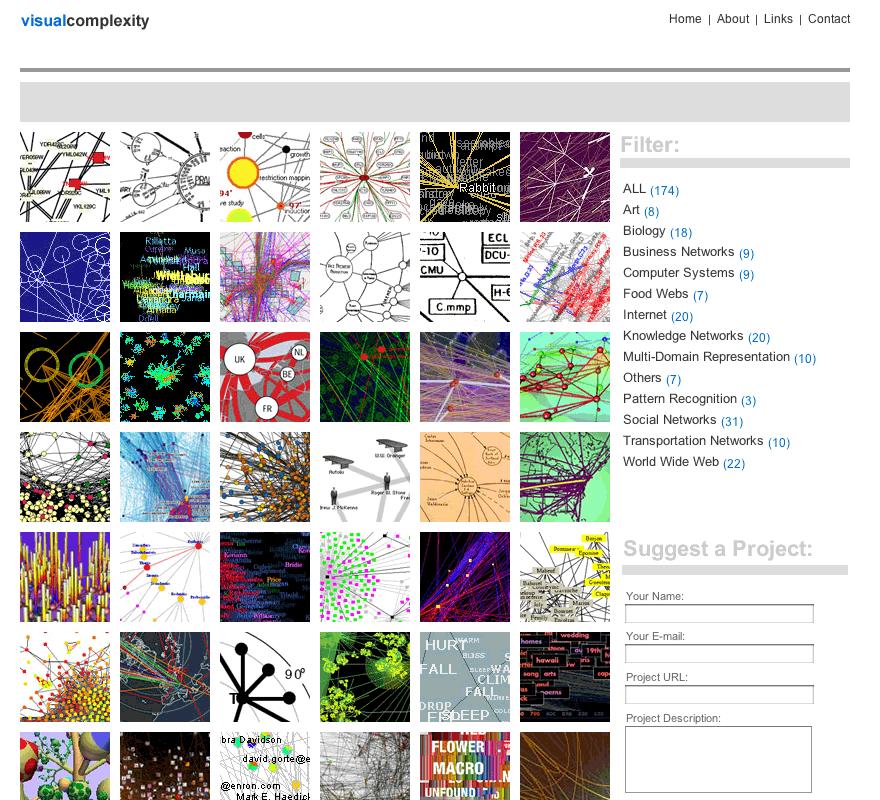
| 09:58, 17 October 2005 | Lima05visualcomplexity.png (file) |  |
181 KB | Screenshot of '''VisualComplexity.com''', a repository of complext network visualizations | 1 |
| 11:39, 14 October 2005 | Mestres05coffeeroom.jpg (file) |  |
9 KB | Coffee room (by Adria Navarro Mestres) | 1 |
| 11:30, 13 October 2005 | Leung94polyfocal.gif (file) |  |
113 KB | Polyfocal display [Leung and Apperley, 1994] | 1 |
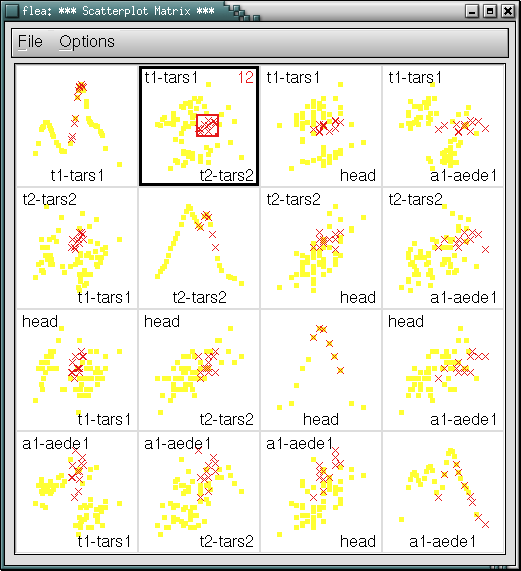
| 08:49, 13 October 2005 | Ggobi04brushlink.png (file) |  |
17 KB | Linking and brushing in a scatterplot matrix (image created with [http://www.ggobi.org GGobi] [Voigt, 2002] | 1 |
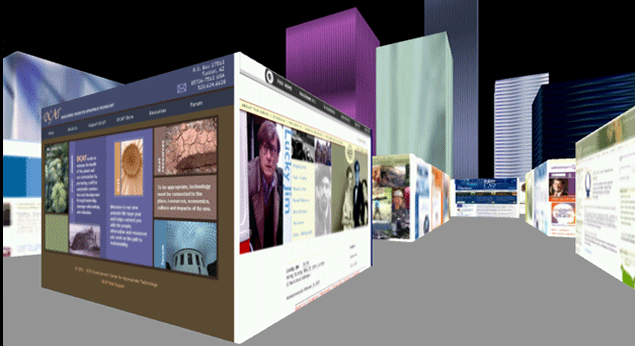
| 08:58, 10 October 2005 | ThreeB043B browser.png (file) |  |
183 KB | 3B browser | 1 |
| 10:36, 4 October 2005 | Aigner03infovis ue.gif (file) |  |
5 KB | Logo of the Lecture "Informationsvisualisierung" | 1 |
| 08:45, 4 October 2005 | Aigner04carevis.gif (file) |  |
30 KB | CareVis application window - Interactive Visualization Methods to Support Protocol-Based Care | 1 |