PlanningLine

[Aigner et al., 2005]

[Aigner et al., 2005]
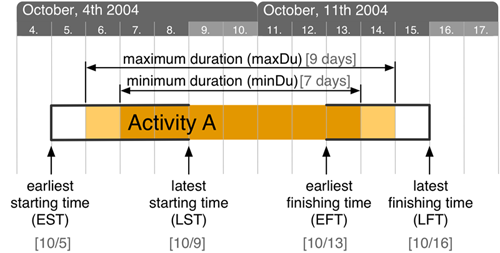
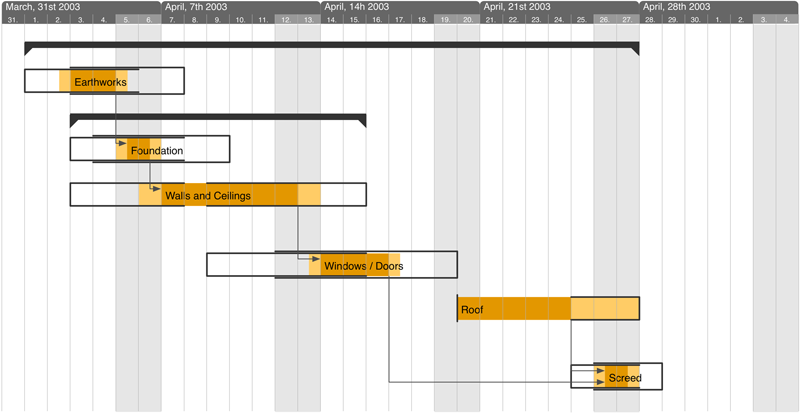
PlanningLines are glyphs to represent complex, indeterminate planning tasks and their hierarchical structure in a simple and intuitive manner.
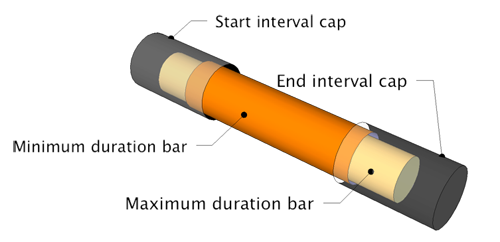
The glyph consists of two encapsulated bars, representing minimum and maximum duration, that are bounded by two caps that represent start and end intervals.
Temporal Attributes
For reflecting temporal uncertainties, begin, end, and duration of activities are modeled as intervals including a set of six attributes:
- start interval
- earliest starting time [EST]
- latest starting time [LST]
- end interval
- earliest finishing time [EFT]
- latest finishing time [LFT]
- duration
- minimum duration [minDu]
- maximum duration [maxDu]
Mental Model
In order to facilitate a straight forward explanation, a simple mental model is used. The two black caps representing begin and end interval are mounted at the time scale. These caps are holding two encapsulated bars that represent minimum and maximum duration. Furthermore, the bars can be shifted within the constraints of the two mounted caps.
Example

[Aigner et al., 2005]
Application
CareVis Interactive Visualization Methods to Support Protocol-Based Care
References
- [Aigner et al., 2005] W. Aigner, S. Miksch, B. Thurnher, S. Biffl. PlanningLines: Novel Glyphs for Representing Temporal Uncertainties and their Evaluation. Proceedings of the 9th International Conference on Information Visualisation (IV05), IEEE Computer Society Press, p. 457 - 463, 2005.
- [Biffl et al., 2005] S. Biffl, B. Thurnher, G. Goluch, D. Winkler, W. Aigner, S. Miksch. An Empirical Investigation on the Visualization of Temporal Uncertainties in Software Engineering Project Planning. Proceedings of the International Symposium on Empirical Software Engineering (ISESE 2005), IEEE Society Press, p. 437 - 446, 2005.