Patterns:Details-on-demand
Summary
Category
Interaction
Context
Data items presented with detailed information hidden.
Problem
How to show the user details about a specific item or items of interest.
Forces
- Lack of screen space.
- Need to see specific data attribute values, i.e. text labels.
- Permanent display of details about items.
Solution
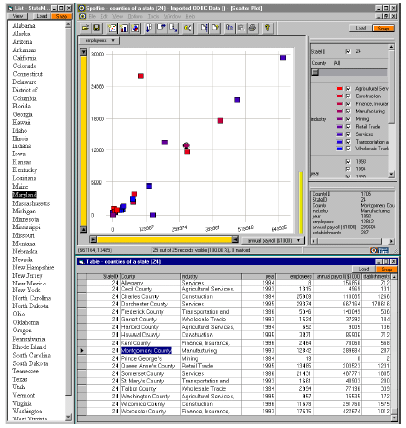
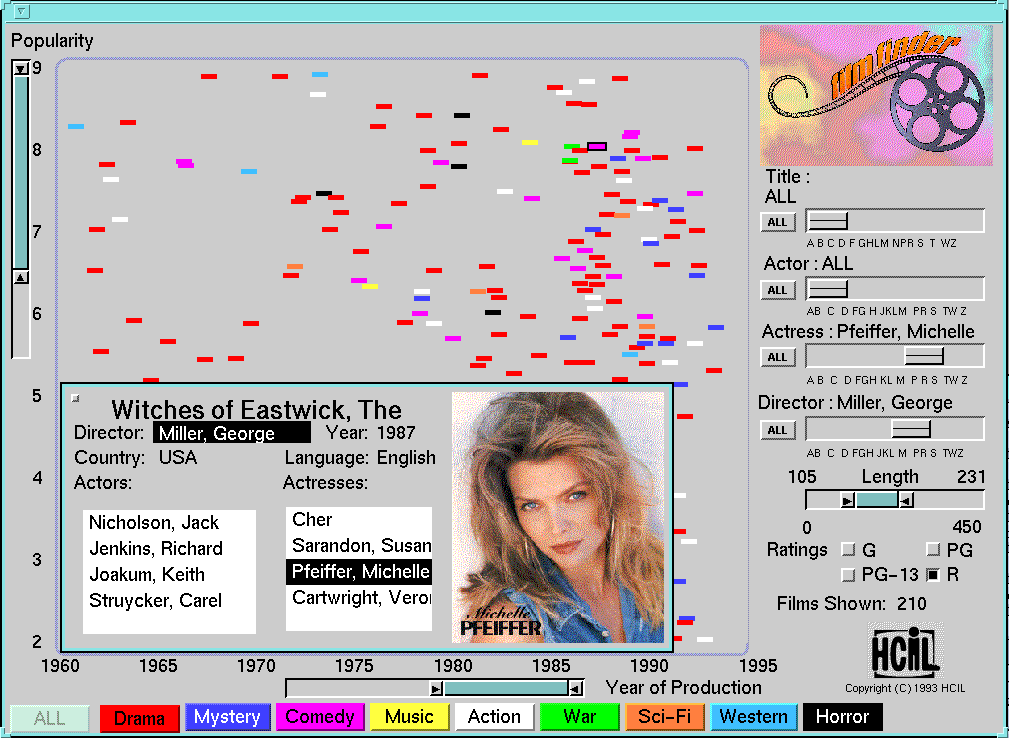
Use a separate window to display item details.
A visualisation should allow the user to view data item attribute values. Datatips can be used to show a temporary details on demand window. The advantages of the datatips technique are that no mouse clicks are required, just pointing, and since the window is temporary it only interferes with the display for a short time. Both Brath [1] and Eick [2] recommend this approach.
An alternative is to display the details in a completely separate window. This more permanent window is useful if the details need to be frequently referred to but at the cost of increasing screen clutter. So far, a mechanism for converting the popup window into a separate permanent window has not been described but this may be a useful feature.
Examples


Related Patterns
References
- ↑ Brath, R. (1999) Effective Information Visualization : Guidelines and Metrics for 3D Interactive Representations of Business Data. Masters of Computer Science Thesis, Graduate Department of Computer Science, University of Toronto, Canada.
- ↑ Eick, S.G. (1995). Engineering Perceptually Effective Visualizations for Abstract Data. In: Nielson, G.M., Hagen, H., Muller, H. eds. Scientific Visualization Overviews, Methodologies and Techniques. USA: IEEE Computer Science Press. pp 191-210.
- ↑ North, C., Shneiderman, B. (1999a). Snap-Together Visualization: Coordinating Multiple Views to Explore Information. University of Maryland Computer Science Dept. Technical Report; #CS-TR-4020.
- ↑ North, C., Shneiderman, B. (1999b). Snap-Together Visualization: Evaluating Coordination Usage and Construction. University of Maryland Computer Science Dept. Technical Report;#CS-TR-4075.
- ↑ North, C., Shneiderman, B. (2000). Snap-Together Visualization: A User Interface for Coordinating Visualizations via Relational Schemata. In: Advanced Visual Interfaces ’00. Palermo, Italy, 23-26 May 2000. pp 128-135.
- ↑ Ahlberg, C., Shneiderman, B. (1994). Visual information seeking: tight coupling of dynamic query filters with starfield displays. In: Human Factors and Computing Systems. Boston, USA, 24-28 April 1994. pp 313-317.
See also: Wilkins, B., (2003). “MELD: A Pattern Supported Methodology for Visualisation Design”, PhD Dissertation, University of Birmingham, UK.