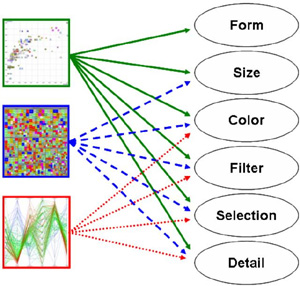
PRISMA - A multidimensional information visualization tool
Authors
- Paulo Igor A.Godinho
- Bianchi Serique Meiguins
- Aruanda Simões Gonçalves Meiguins
- Ricardo M. Casseb do Carmo
- Marcelo de Brito Garcia
- Leandro Hernandez Almeida
- Rodrigo Lourenço
Short description
Interface
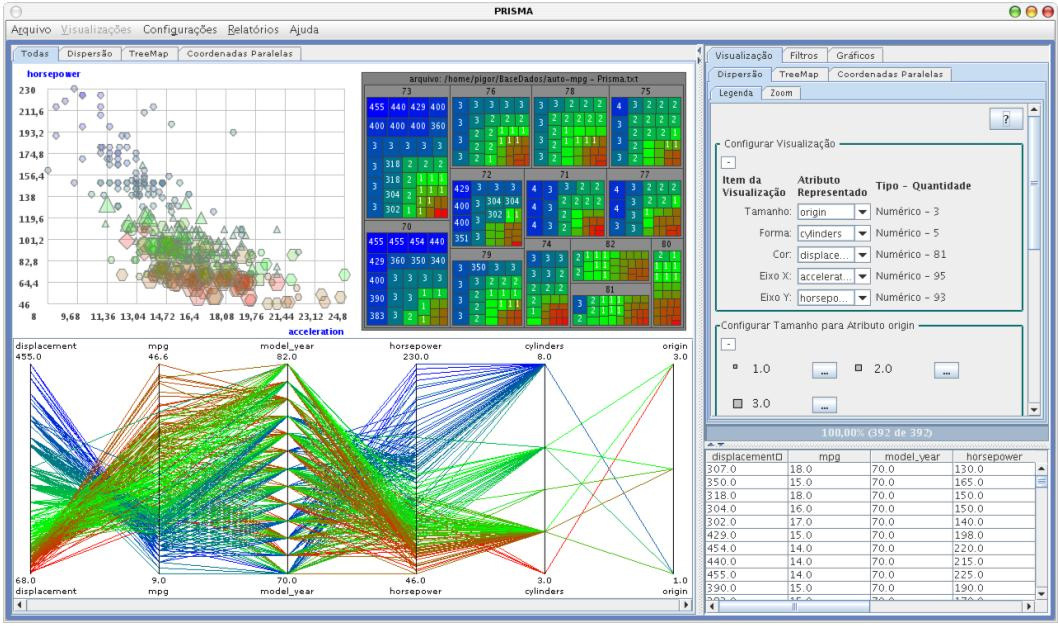
This figure shows the main User Interface of Prisma after loading a dataset. All options are in Portoguese.
Main Functions
Treemap
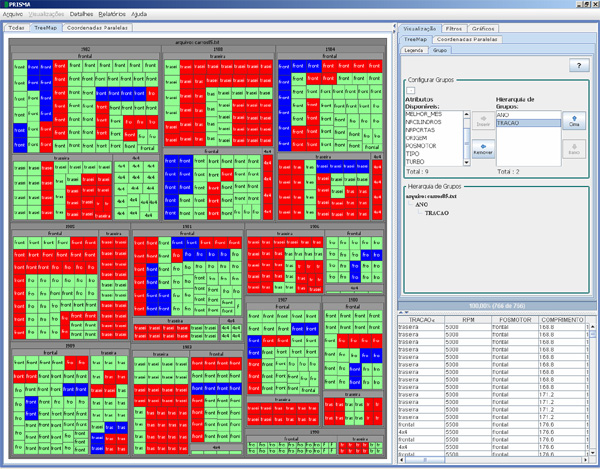
Treemap: The user can set the attribute representing each rectangle size and color.
Scatterplot
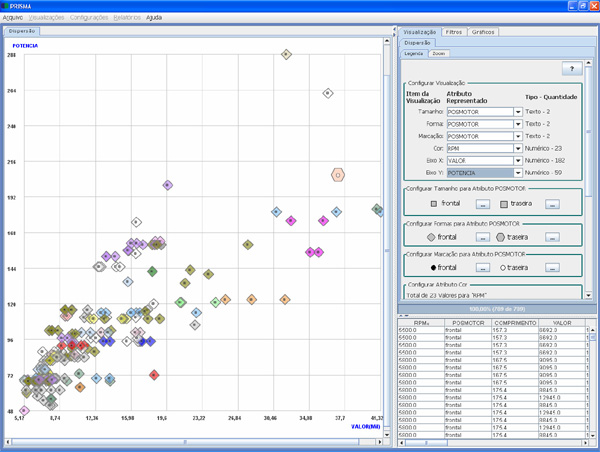
The scatterplot technique is based on the cartesian coordinate system. The user can select which attributes are represented by the X or Y axis.
Parallel Coordinates
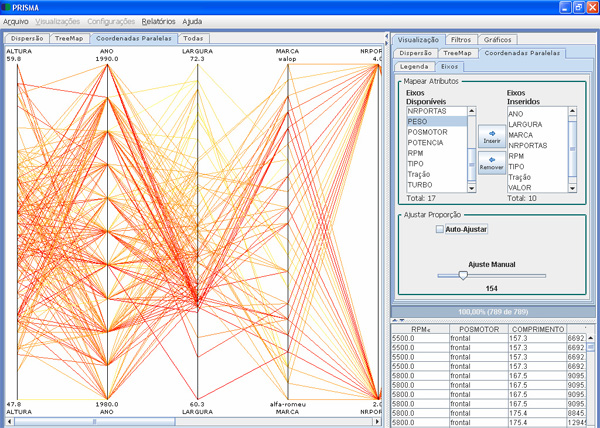
Each axis represent a dimension which is arranged parallel. The lines connect the attributes of the data items.
Coordination
Selection
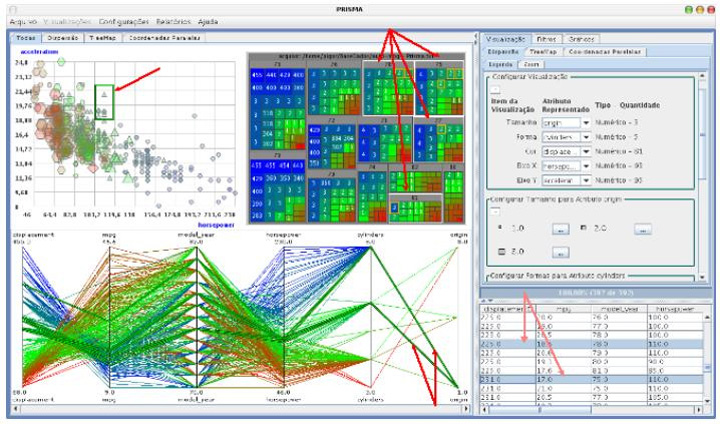
This figure shows the selection feature used on the starting dataset.
Details on demand
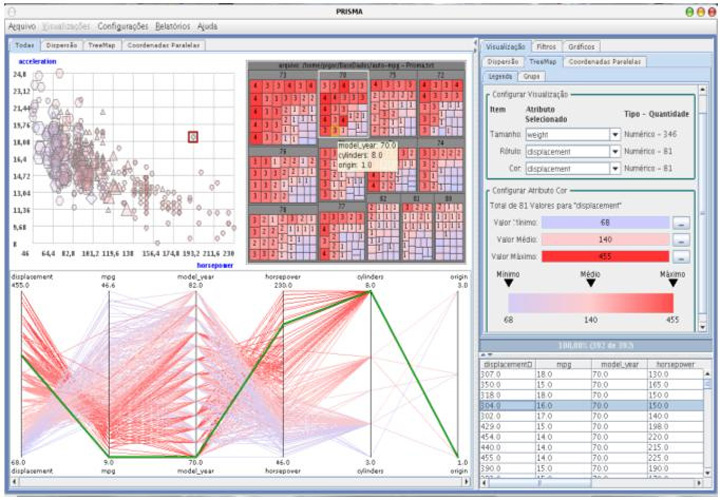
After selecting an attribute the user can gather additional information by using the details-on-demand function.
Filter
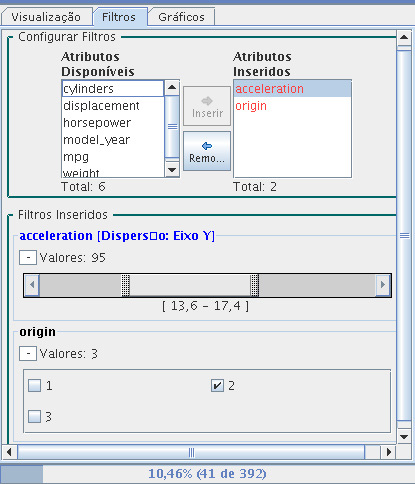
The filter dynamic interface. This function helps reducing the overload in the user interface if the dataset is very big (with the range filter in this example).
Other Functions:
PRISMA also includes:
- Pie, Line and Bar graphics
- a report generator
- a export data function
Evaluation:
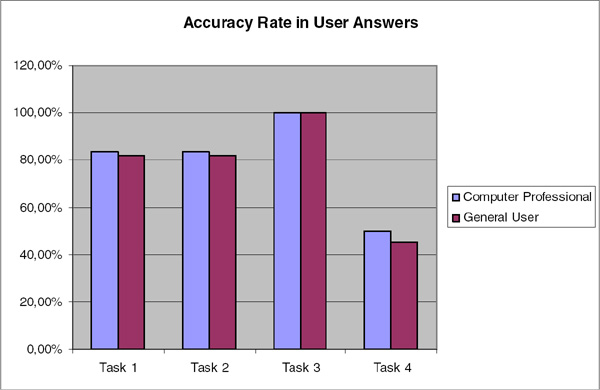
A usability test has been carried out with 11 persons (6 Computer Professionals and 5 General Users). Each person had to solve 4 tasks using PRISMA.
References:
PRISMA - A Multidimensional Information Visualization Tool Using Multiple Coordinated Views
