Mining and Visualizing Activity Patterns in Social Science Diary Data
Authors
Short description
Figures
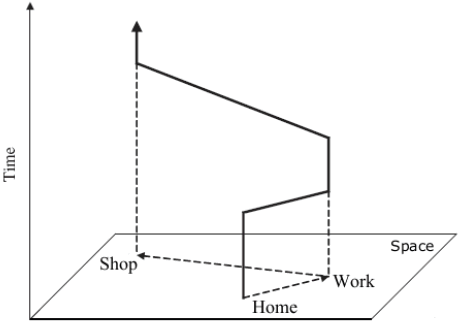
The original time geographical representation of human space-time behaviour. The, so called, ‘space-time path’ is a vertical trajectory representing the movement of an individual in space and time.
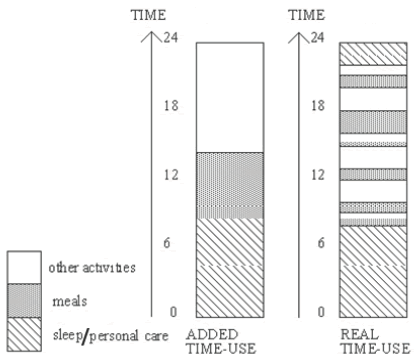
Traditionally time-use studies use representations that account for the accumulated time used for activities during the day. This ‘added time-use’ representation, seen in the left, hides information that may be important to a social scientist, for example when during the day an activity occurs, how many times per day and for how long. The ‘real time-use’ representation, seen in the right, clearly reveals this information.
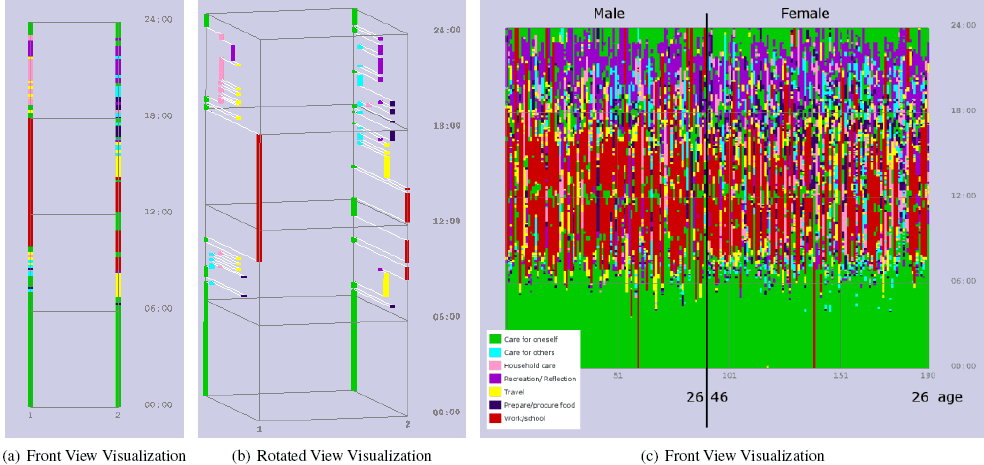
Visualizations in the Visual-TimePAcTS framework. (a) shows the activity paths of a couple viewed from the front. This view is the ‘real time-use’ representation showing the switch between activities performed during a work day. (b) shows a slightly rotated view of the activity paths where the ‘movement’ between the activities and hence the similarity to the original ‘space time path’ becomes clear. (c) shows the front view visualization, which is the ‘real time-use’ representations, of a population subset in the visualization framework. Time is shown in the y-axis and the individuals are ordered along the x-axis by age and gender. Colours represent the 7 activity categories.
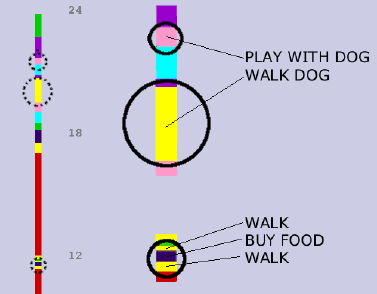
Visualization of an individual’s activity path showing examples of two pattern types. In the pattern <‘walk’;‘buy food’;‘walk’> the pattern activities occur immediately after each other in the activity path of the individual giving a zero gap (gap = 0). The activities of the pattern <‘walk the dog’;‘play with the dog’>, however, are separated in the activity path by two other activities which are not a part of the pattern, resulting in a gap of two (gap = 2).
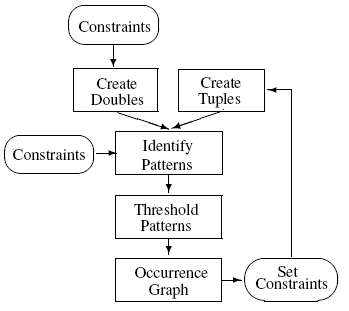
Overview of the pattern identification algorithm. The algorithm is an adapted AprioriAll algorithm.
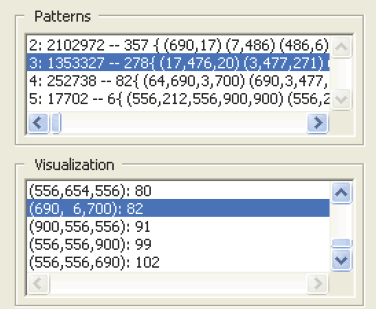
Results of the pattern identification algorithm as seen in the graphical user interface of the VISUAL-TimePAcTS application. In the figure the 278 identified pattern triples (3 − tuples) are selected and listed. From the pattern list the pattern <‘prepare food’; ‘eat dinner’; ‘wash up after dinner’> (<690; 6; 700>) is selected which occurs 82 times in the selected population subset.
An example of patterns identified by the algorithm. The triple pattern <prepare food; eat dinner; wash up after dinner>, (a), shows that this pattern is performed mostly by women. It’s subpattern <eat dinner; wash up after dinner>, (b), shows that more men are engaged in this pattern but the majority is still women. Finally at the single occurrence of the activity <eat dinner>, (c), shows that it is equally distributed between both sexes. This example shows the uneven division of labour within the household which becomes obvious through the visualization of the everyday patterns of the sample population.
Suitable Datatypes
A data structure is used to keep track of the information
produced by each iteration of the algorithm. An array of the individuals activities and an array of
locations where it occurs are also recorded.
Important Citations
Evaluation
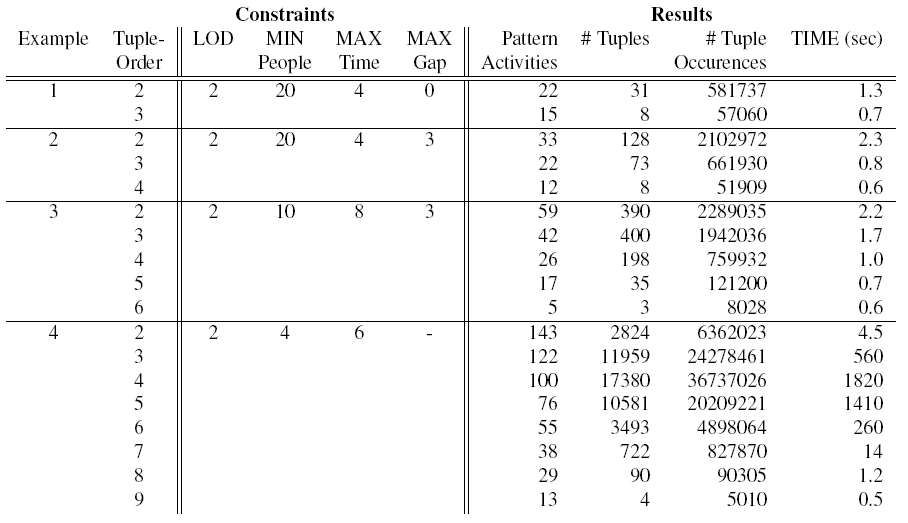
The algorithm was run for individuals between age 26 and 46 with activity level of detail 2 (1 being the most detailed), resulting in a set of 190 individuals including 7303 activities. A constraint of maximum pattern duration of 4 hours was set, requiring that in order to be valid each pattern should commence and end within a 4 hour time window. The constraint that no gaps should be present in the activity path between the adjacent pattern activities was also set. Finally, each pattern must be present in the activity paths of a minimum of 20 individuals.
Table of results from running the algorithm for individuals aged 26 to 46 and testing various constraints. The dataset includes 190 individuals, 7303 activities. The algorithm was run on a standard desktop PC with a 3GHz P4 CPU and 1GB RAM. These results show that patterns can be extracted in interactive times for large subsets of the population, as long as some constraints are set on the pattern search.
References
[Vrotsou K., Ellegård K., Cooper M.] Mining and Visualizing Activity Patterns in Social Science Diary Data. In: Information Visualization, 2007. IV '07. 11th International Conference, pages 130-138, Zurich, Switzerland, 2007.
Evaluation Reference
[Vrotsou K., Ellegård K., Cooper M.] Mining and Visualizing Activity Patterns in Social Science Diary Data. In: Information Visualization, 2007. IV '07. 11th International Conference, pages 130-138, Zurich, Switzerland, 2007.
