Glyph
Definition
A primitive example of a glyph is an arrow whose visual attributes length, width, angle, and color might be used to encode four different data attributes in a single graphical object.
The most prominent example for glyphs are Chernoff Faces [Chernoff, 1973], where the different parts of a conceptualized human face (mouth, nose, head, eyes, eyebrows, etc.) encode different dimensions of an n-dimensional data set.
Advantages of glyph representations are foremost their easy learnability, long remembering periods, and the possibility to represent value restrictions visually, especially when multiple attributes are involved.
Synonyms
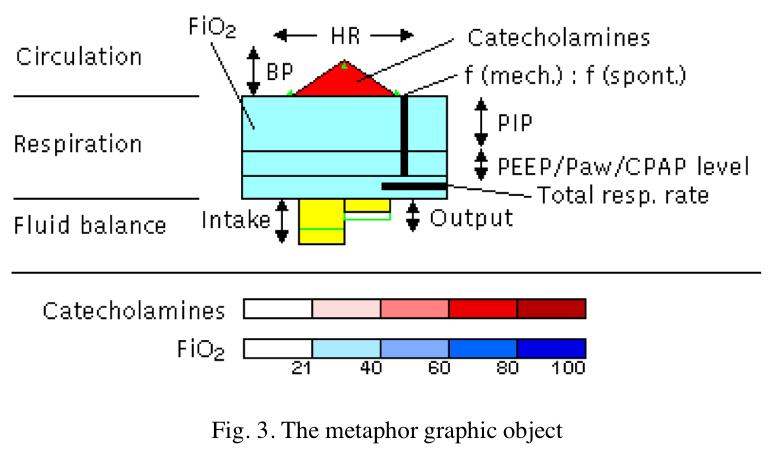
- Metaphor Graphic
Examples
VIE-VISU
An interactive glyph technique that is used for time oriented analysis of electronic patient records is VIE-VISU [Horn et al., 1998]. The motivation for their development was the fact that paper-based analysis of patient records is very hard to conduct because many parameters are involved and an overall assessment of the patient's situation is hard to maintain. The glyph display helps to combine different measurements, maintaining their relationships, show their development over time, and make specific, possibly life threatening situations, easy to spot. The used glyph basically consists of three parts that represent circulation, respiration, and fluid balance parameters (top to bottom). All in all, 15 different patient parameters are combined to form this glyph. Each glyph represents a one hour period and 24 glyphs are combined in a single screen

Glyphs in Typography

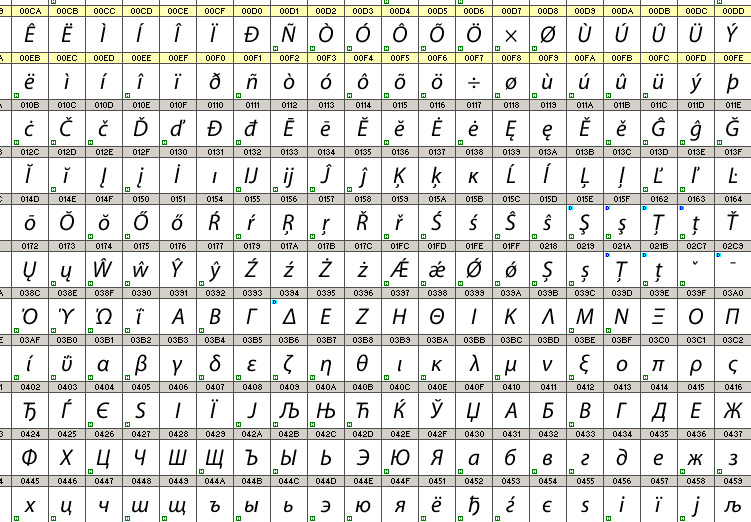
A character is a textual unit, whereas a glyph is a graphical unit. Sometimes several characters or only parts of one glyph — consider ligatures as an example.
Related Links
References
- [Chernoff, 1973] Herman Chernoff. The Use of Faces to Represent Points in k-Dimensional Space Graphically, Journal of the American Statistical Association, 68: 361-368, 1973.
- [Horn et al., 1998] Werner Horn, Christian Popow, and Lukas Unterasinger. Metaphor Graphics to Visualize ICU Data over Time, In Proceedings of Intelligent Data Analysis in Medicine and Pharmacology (IDAMAP-98), Workshop Notes of the ECAI-98 Workshop, 1998.
- [Keller and Keller, 1993] P. R. Keller and M. M.Keller. Visual Clues Practical Data Visualization. IEEE Computer Society Press, 1993.
- [Ware, 2004] Colin Ware. Information Visualization: Perception for Design, Second Edition, Morgan Kaufmann Publishers: San Francisco, CA, 2004.