Evaluating Information Visualization Applications
Author
Short Description
There are two different types of "Human Computer Interacion Evaluation Methods":
- Analytic Methods
- Empiric Methods
- Quantitave Studies
- Qualitative Studies
CourseVis
Figures
The following visualizations are used to represent the collected data from CourseVis:
- Access Plot:
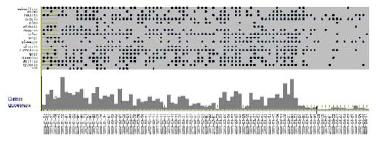
The access plot shows the students' accesses to the course. It is an mixture of a scatterplot and a histogram.
The scatterplot shows the data of students and of the course while the histogram shows the number of pages of the course accessed by all students on a special date.

- Discussion Plot:
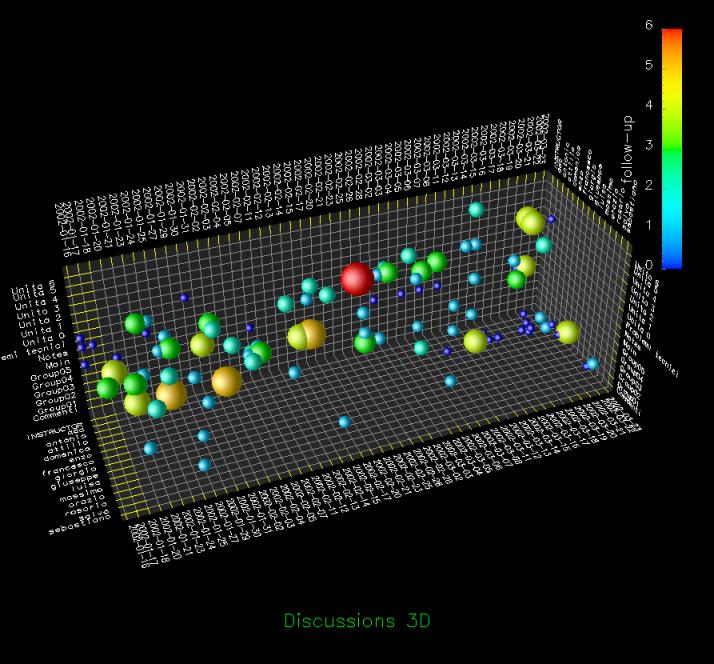
This 3D scatterplot is about the disussions of the course. The figure shows time, topics and students.
The sphere represents a new thread and the number of messages are encoded with the color and size of the sphere.

- Behavioural Graph:
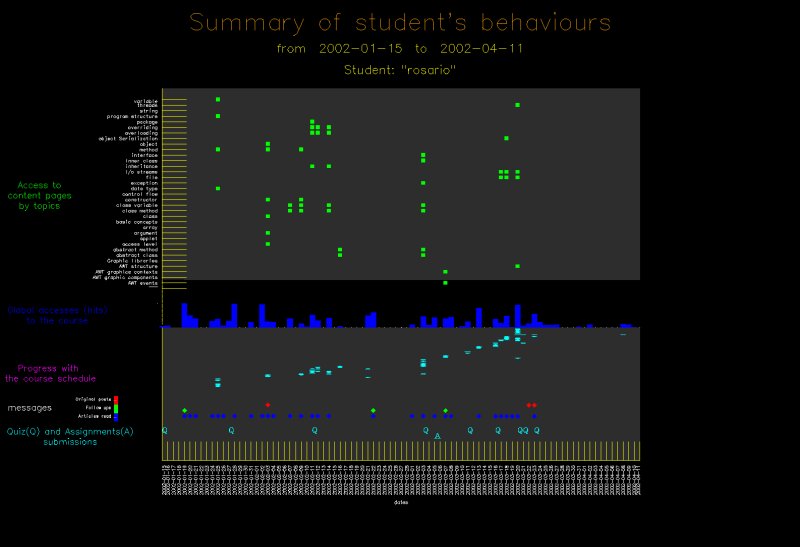
This graph represents the behaviours of a single student.
It shows the student's access to the content pages, the global access to the course, a progress with the schedule of the course, messages and the submission of quizzes and assignments.

Evaluation Types
- Focus Group
- Controlled Experiment
- Semi-structured Interview
Important Citation
via the social gathering and the interaction which being in a focus
group entails
References
- CourseVis
- [Mazza and Dimitrova, 2004] Mazza, Ricardo; Dimitrova, Vania. Visualising student tracking data to support instructors in web-based distance education. In Proceedings of the 13th international World Wide Web conference on Alternate track papers & posters, pp. 154-161. 2004.
- [Mazza, 2006] Mazza, Ricardo. Evaluating information visualization applications with focus groups: the CourseVis experience. In Proceedings of the 2006 AVI Workshop on Beyond Time and Errors: Novel Evaluation Methods For information Visualization, pp. 1-6, 2006.