Teaching:TUW - UE InfoVis WS 2009/10 - Gruppe 13 - Aufgabe 4: Difference between revisions
No edit summary |
No edit summary |
||
| Line 75: | Line 75: | ||
In comparison to "content", the "important events in life" is nominal discrete value. Particular values could be "graduation", "Nobel price for peace", "imprisoned", etc. Events are assigned to intervals or instants, i.e. "graduation" can be assigned to instant 20. May 1990, but "imprisoned" will be assigned to interval 20. May 1990 - 20. May 1995. | In comparison to "content", the "important events in life" is nominal discrete value. Particular values could be "graduation", "Nobel price for peace", "imprisoned", etc. Events are assigned to intervals or instants, i.e. "graduation" can be assigned to instant 20. May 1990, but "imprisoned" will be assigned to interval 20. May 1990 - 20. May 1995. | ||
====Graduate==== | |||
This is a boolean value with yes when graduated or no if not. | |||
===Target audience=== | ===Target audience=== | ||
| Line 97: | Line 101: | ||
====Subtree Selection for Comparison==== | ====Subtree Selection for Comparison==== | ||
With Ctrl + click you can select subtrees for comparison in both family trees | With Ctrl + click you can select subtrees for comparison in both family trees | ||
[[Image:compare-detail.png]] | [[Image:compare-detail.png]] | ||
====Subtree Additional Information==== | |||
[[Image:Add info.JPG]] | |||
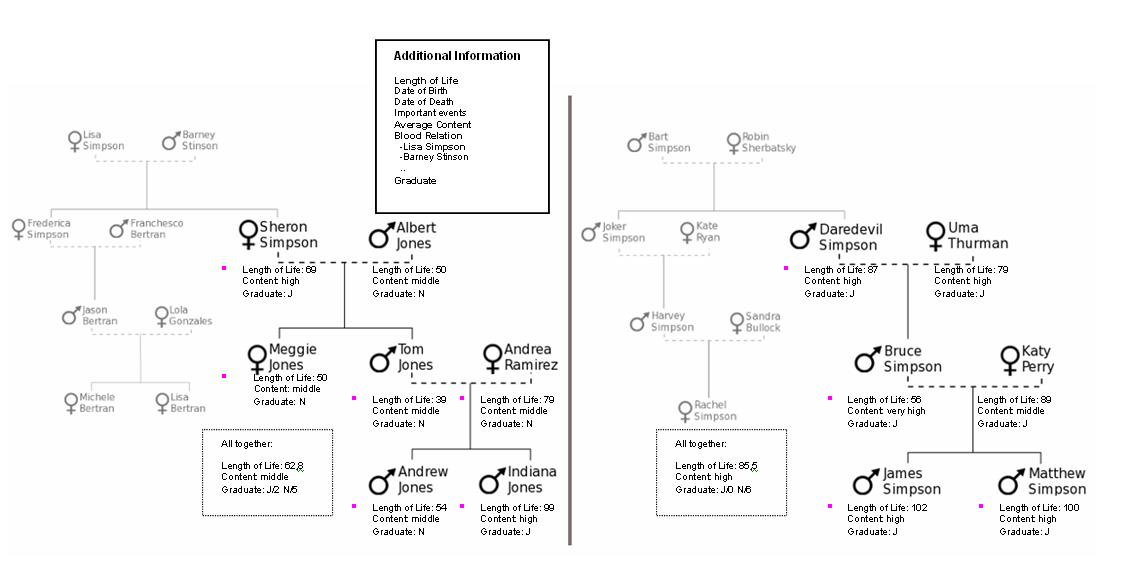
To compare the subtrees in the overview section it is useful to have the possibility to add additional information to name and sex. The user can choose the attributes given in the box Additional Information. | |||
It is possible to choose one or more categories. In this case, length of life, content, graduate and blood relation are chosen. For blood relation it is additionally necessary to define a name. After the name is chosen, in every subtree all people are marked with a pink point who have a blood relationship with this person. The attribute content shows just the average content because there is not enough space to display a bar. If a user wants to see this information in more detail, he has to use the option Member Detail. | |||
With the given Information it is now possible to compare the two parts of the trees. For example, it seems to be that the members of the right subtree are more satisfied with there life than the members of the left subtree. To get a quick overview some attributes are summarized for every subtree in an additional box (not all attributes are displayed because date of birth or date of death can not be summarized in a meaningful way). The attribute important events would be displayed in this box as a list of all important events of all members ordered by date. | |||
If I want to use these options to answer the question to study or not, I can see that the subtree with more graduated members seems to have a more “happy” life. Maybe they have also more successful important events? Then I would add the important event attribute in the overview section or use the Member Detail option… | |||
====Member Detail==== | ====Member Detail==== | ||
Revision as of 20:15, 6 January 2010
Aufgabenstellung
Zu erstellende Visualisierung
- Stammbaum der Nachkommen von Lisa und Bart Simpson*
...Visualisierung der Nachkommen von Lisa Simpson sowie der Nachkommen von Bart Simpson. Dabei sollen zwei Stammbäume entstehen - einer von Bart und einer von Lisa - die dann miteinander verglichen werden können. Zuerst kommen Lisa und Bart, dann deren Kinder, ihre Enkel, etc. (mind 4 Generationen). Da es noch keine Nachkommen gibt, können diese frei erfunden werden.
Die Visualisierung soll folgende Informationen darstellen:
- Verwandtschaftsverhältnisse (zumindest Eltern-Kinder),
- Unterscheidung zwischen Blutsverwandtschaft und angeheirateten Familienmitgliedern,
- Geburts- und Todestag sowie Lebensdauer von allen Familienmitgliedern,
- wichtige Ereignisse im Leben jedes Familienmitglieds (z.B., Anzeigen, Gefängnisaufenthalte, Schulzeit, Studienzeit, Nobelpreise, Arbeitslosigkeit etc.)
- Zufriedenheit jedes Familienmitglieds (Skala: sehr niedrig - niedrig - mittel - hoch - sehr hoch); kann sich im Laufe des Lebens ändern.
Die Visualisierung soll die interaktive Auseinandersetzung mit den Daten ermöglichen. Verpflichtend: Möglichkeiten zum besseren Vergleich von einzelnen Abschnitten der Stammbäume bzw. Vergleich von Ausschnitten aus Lisas und Barts Stammbäumen. + mind. 2 weitere Interaktionsmöglichkeiten (z.B., Details on Demand, Filteroptionen)
Allgemein:
- Die Daten sollen zur Analyse von Zusammenhängen zwischen Familienverhältnissen, wichtigen Ereignissen und Zufriedenheit visualisiert werden (die Anwendungsgebiets- und Zielgruppenanalyse kann kurz gehalten werden).
- Die bisher erlernten Design-Prinzipien sollen umgesetzt werden z.B.: Optimierung der Data-ink ratio (keine Comics!), visuelle Attribute (Größe, Farbe, Position, etc.) sollen sinnvoll eingesetzt werden (Information darstellen).
- Die Mockups sollten zumindest 1) die beiden Stammbäume im Überblick und 2) eine detaillierte Vergleichsansicht von 2 Teil-Stammbäumen wiedergeben.
- Alle nicht angeführten Daten können frei erfunden werden.
Area of application
Data set analysis
Visualization will display information about family relationships, difference between blood and by marriage relatives, dates of birth and death, length of life, content (happiness) during life, important events in life. From this the overall view should be focused on family relationships and type of family membership. The rest (length of life, birth and death dates, content, important events) are particular details of one person and therefor are not concern of other members in visualization.
Family Relationship
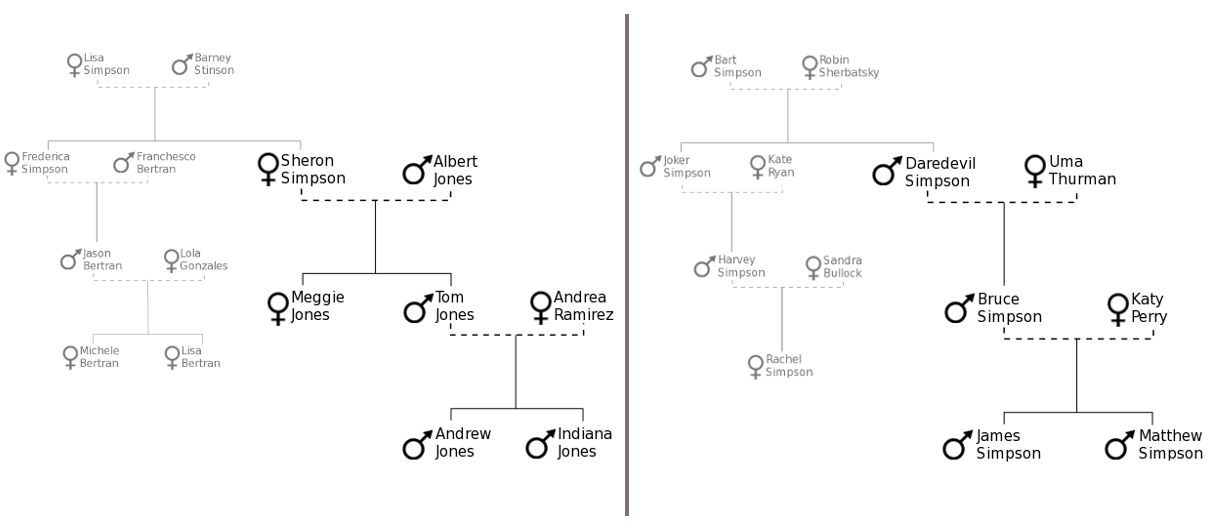
This information has hierarchical structure where the root of each tree are the oldest ancestors (Lisa and her husband, Bart and his wife) and leaf nodes are their (grand...)children.
Data are nominal and discrete. To be able to display the tree we need actually only names and surnames of particular members and then to connect and display them in tree structure.
Difference between blood and by marriage relatives
This requires 3-dimensional structure. First dimension and second dimension contains members of family and third describes the type of relationship where relationship exists.
Value is logical true/false value assigned to relationship between two people.
Length of life
Since this information is private for person and it won't be displayed as a summary for all members in one graph, it is simple 1-dimensional data structure.
The value describing length of life is discrete and numerical, e.g. 40 years.
Date of birth and day of death
As well as length of life is this information also simple 1-dimensional data structure. Data are discrete and ordinal, e.g. 20. January 1990.
Content (happiness)
Content of person in particular parts of life is temporal structure.
The content is ordinal discrete value from following possibilities (ordered from best to worse):
- very high
- high
- middle
- low
- very low
Time is defined in intervals to which person has one of introduced content levels assigned.
Important events in life
The last information is also temporal structure.
In comparison to "content", the "important events in life" is nominal discrete value. Particular values could be "graduation", "Nobel price for peace", "imprisoned", etc. Events are assigned to intervals or instants, i.e. "graduation" can be assigned to instant 20. May 1990, but "imprisoned" will be assigned to interval 20. May 1990 - 20. May 1995.
Graduate
This is a boolean value with yes when graduated or no if not.
Target audience
Despite the fact that The Simpsons is cartoon, its audience consists mainly of adults. According to "The Simpsons, Innovation and Tradition in a Postmodern TV Family"[Matia Miani] 94 percent of audience was over 18 already in first season. However, our visualization should be targeted on the younger part of this group, in our opinion targeted audience should consist of students with age starting from 17 years. Such set age should guarantee that also students finishing high school will be in targeted audience.
The targeted audience is not specialized group of people like doctors or electrical engineer and even when they should be students, they will have mostly general education. Thus information should be presented in a simple way with simple and well known words and phrases. Some parts like a gender of person could be displayed for example using icons.
Purpose of visualization
Students with age around 18 years should be facing problem whether to continue studies on university or finish with studies. Visualization we are creating can thus help these students to see impact of this decision on the future life. Bart's and Lisa's family tree with important events and happiness during each member's life can be a funny way how this information could be presented. Since Bart and Lisa don't have families, actually they are only kids at the moment, the data presented with introduced members could be taken from real life statistics.
Mockup
Overview
Detail of a Subtree and Member
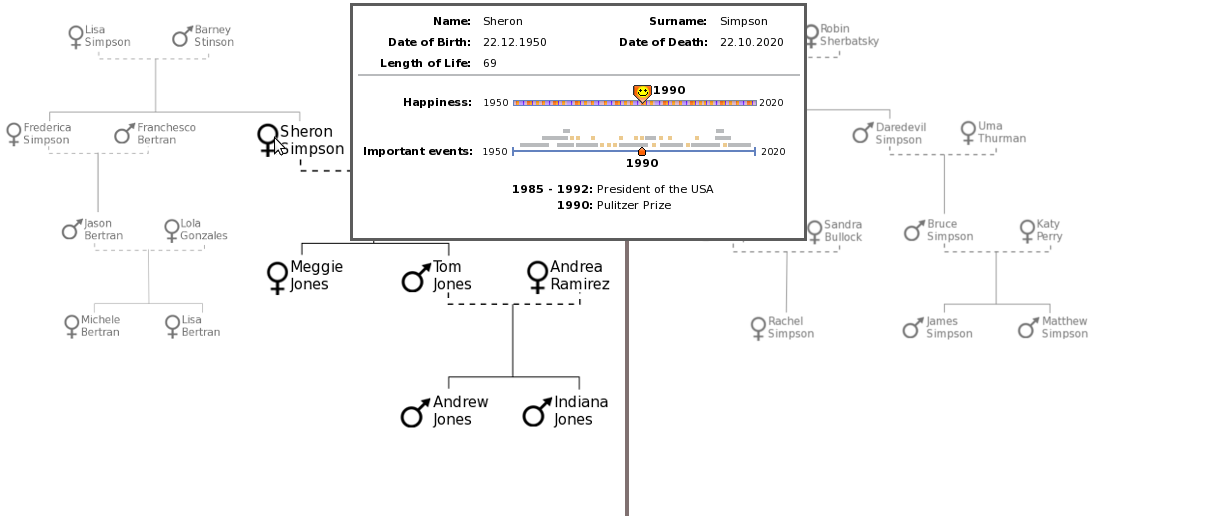
With mouseover you can get through subtrees. When you click on a member a detail of a member will popup.
Subtree Selection for Comparison
With Ctrl + click you can select subtrees for comparison in both family trees
Subtree Additional Information
To compare the subtrees in the overview section it is useful to have the possibility to add additional information to name and sex. The user can choose the attributes given in the box Additional Information. It is possible to choose one or more categories. In this case, length of life, content, graduate and blood relation are chosen. For blood relation it is additionally necessary to define a name. After the name is chosen, in every subtree all people are marked with a pink point who have a blood relationship with this person. The attribute content shows just the average content because there is not enough space to display a bar. If a user wants to see this information in more detail, he has to use the option Member Detail. With the given Information it is now possible to compare the two parts of the trees. For example, it seems to be that the members of the right subtree are more satisfied with there life than the members of the left subtree. To get a quick overview some attributes are summarized for every subtree in an additional box (not all attributes are displayed because date of birth or date of death can not be summarized in a meaningful way). The attribute important events would be displayed in this box as a list of all important events of all members ordered by date. If I want to use these options to answer the question to study or not, I can see that the subtree with more graduated members seems to have a more “happy” life. Maybe they have also more successful important events? Then I would add the important event attribute in the overview section or use the Member Detail option…
Member Detail
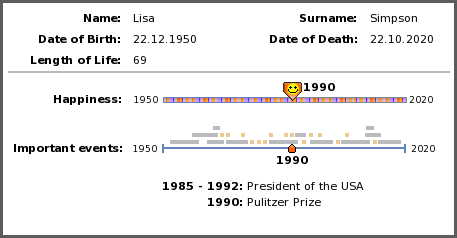
Contains the name of the member and details about birth, death and length of life. Besides this information you can find here also important events and information about happiness in his/her life.
The simple data are written out right to their labels.
Happiness is displayed with slider and timeline that is colored according to happiness in particular lifetime. Slider itself displays color it is pointing at and smiley icon to easier understand the color differentiation.
Important events are presented with another slider and timeline. Above timeline you can see events where instants have light brown and intervals grey color. This approach provides user with overview of density of events in particular lifetime what helps user to move with slider on the place he/her is interested in. The detail of currently pointed lifetime is displayed under the slider as a list of events.
References
[Matia Miani] Matia Miani. The Simpsons, Innovation and Tradition in a Postmodern TV Family, Retrieved at: January 2, 2009. http://www.baskerville.it/premiob/2004/Miani.pdf


