Teaching:TUW - UE InfoVis WS 2008/09 - Gruppe 09 - Aufgabe 4
Aufgabenstellung
Gegebene Daten
Homer Simpson's Trinkverhalten in Abhängigkeit von seinen Lebensumständen
...Visualisierung von Homer's Lebensabschnitten bzw. Ereignissen mit Einfluss auf sein
Trinkverhalten (zB.: Kindheit, Pubertät, Arbeitslosigkeit, Beziehungen, Hochzeit, Geburt
der Kinder, Liebeskummer, Alltag, etc.) von seiner Geburt bis Jetzt + mögliche
Zukunftsszenarien (mind. 3).
- Die Menge folgender Getränke soll für die jeweiligen Lebensumstände ablesbar sein
(ml oder Liter - je nachdem - pro Tag, Monat, Jahr (z.B.: Fokus+Kontext Methoden):
 a) Wasser

 b) Milch

 c) Fruchtsaft

 d) Cola

 e) Kaffee (Würfelzucker?)

 f) Bier
(vereinfacht angenommen, Homer trinkt ausschließlich diese Getränke)
- Die folgenden Werte sollen abhängig von den konsumierten Getränken ablesbar sein:
 1) g oder kg konsumierter Zucker (aus Getränken) + empfohlene Maximaldosis pro Tag, Monat, Jahr
   (empfohlene Maximaldosis/Tag: 50g; enthaltener Zucker: 10g/100 ml Cola; 10g/100 ml Fruchtsaft; 3g/Würfelzucker).

 2) mg konsumiertes Coffein + empfohlene Maximaldosis pro Tag, Monat, Jahr
   (empfohlene Maximaldosis/Tag: 600mg; enthaltenes Coffein: 10 mg/100 ml Cola; 80 mg/100 ml Kaffee).

 3) g konsumierter Alkohol + empfohlene Maximaldosis pro Tag, Monat, Jahr
   (empfohlene Maximaldosis/Tag: 20g; enthaltener Alkohol: 3,6 g/100ml Bier)
- Die Daten sollen zur medizinischen/psychologischen Analyse visualisiert werden.
- Die bisher erlernten Design-Prinzipien sollen umgesetzt werden (z.B.: Optimierung der Data-ink ratio).
- Die Mockups sollten zumindest 1) Homer's Leben im Überblick 2) und eine Detailansicht wiedergeben.
- Alle nicht angeführten Daten können frei erfunden werden.
Analysis
Concept
Visualization
2. Use Graphs when the document you produce will be used to reveal relationships among multiple values.
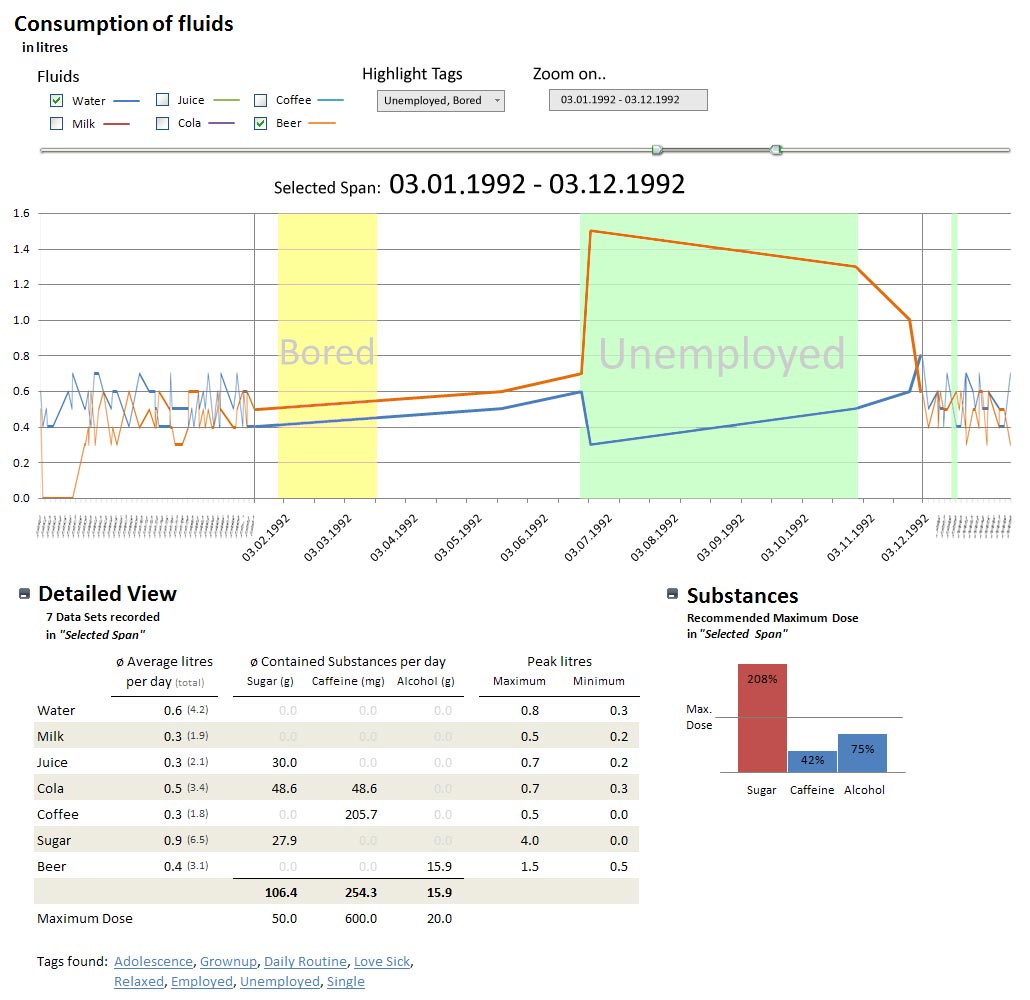
Following the principles of Stephen Few, the main graphic of the visualization is a graph. In order to get an overview of Homer Simpsons drinking habits this visualization method seems superior to any other. Since becoming an overview is this visualizations main task, no detailed information is needed. This, and the fact the there are simply too many values to compare, makes the graph superior to a table. The graph also allows to browse Homer Simpsons life quite easily for any special events. To make this browsing more effecive several interactive technologies where applied. (see "Interaction").
When it comes to analysing detailed information we need an other method. [Few, 2004] recommends using Tables when "The document you produce will be used to look up individual values." For a doctor who wants to set up a therapy or medication, a graph wont be sufficient. He will want detailed and exact data. Therefore, the visualization should also hold a detailed table view (in addition to the overview graph).
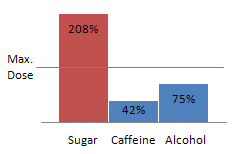
Finally, to look up if a maximum dose was exceeded, a part-to-whole bar chart is also contained in the visualization. This visualization method "Measures [..] individual categorical subdivisions as ratios to the whole." [Few, 2004] Since the task is to compare given values to a maximum values and display theri ratios, this methods seems appropriate.


The visualization now holds:
- Flow graph
- Detail table
- Substance part-to-whole bar chart
Visual Mapping
- Flow graph [Figure 1]
In the Flow graph the consumed amount of Fluids (in litres) is mapped to the y-axis while Homer Simpsons age/life-period is mapped to the x-axis. The key events in his life (described by "Tags") are mapped as an area to both axes.
- Detail table [Figure 2]
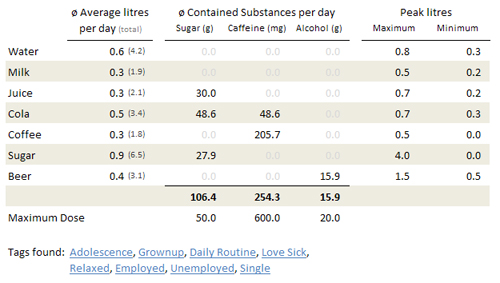
In the detailed view table things are relatively simple: all values are directly mapped into a table values.
The table holds the average consumpted litres, the average thereby consumpted substances and the peak values for a given period of time. It also contains a list of all tags which where found in this period of time (e.g. "Unemployed"). In order to grant interpretation of this data, the table also holds the maximum doses for substances.
For the task of checking wheter a maximum dose was exceeded or not, one can also take look at the..
- Substance part-to-whole bar chart [Figure 3]
Like mentioned above, this chart holds the values of all consumpted substances and their maximum value. To make the comparison more easy, the values are displayed as a bar and compared against a line which describes the maximum doses.
Technologies Used
TBA
Interaction
- Zoom Bar
- Mouse Over
- Zoom on ..
- Select fluids
Mockups
Discussion
- (General) _später entfernen_
- Advantages
- Disadvantages
Improvements
References
- [Few, 2004]:Stephen Few, Show Me the Numbers: Designing Tables and Graphs to Enlighten, Analytics Press, 2004, Appendix A - Table and Graph Design at a Glance.
