Aufgabenstellung
Beschreibung der Aufgabe 2
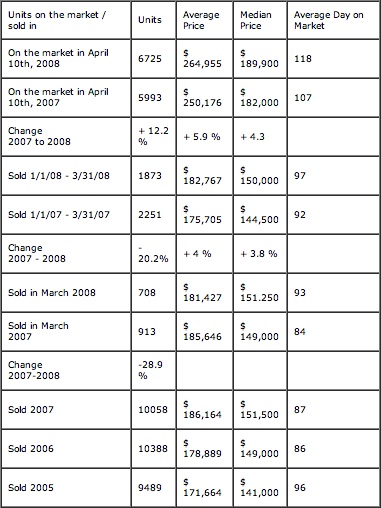
Zu beurteilende Tabelle

Links
Critics on the table
- Table borders are not needed since they contain no additional information.
- Label of the table is missing, so the whole statistics is hard to understand.
- Table rows contain different information and units, e.g. "Sold", "On the market" and "Change".
- Units (% and $) within the table cells are bad formatted. Could be extracted and written to table headers.
- Some units are explizitly displayed (% and $), others not even defined (last column).
- Dimensions of table columns are not properly assigned. Last column is far to wide, others are to short (or bad formatted).
- Header information of first column is used in table cells again.
- Numbers are aligned left, so they are hardly comparable and readable.
- The serparator of numbers (in table column "units") is missing. Not consistent through whole statistics.
- Precision of numbers is not constistent as well.
- Confusing naming of table cells, e.g. "Change 2007-2008" references change from March 2007 to March 2008.
- Missing percentages for Change from March 2007 to March 2008.
Optimized Table

Improvements

