Teaching:TUW - UE InfoVis WS 2008/09 - Gruppe 08 - Aufgabe 2: Difference between revisions
Jump to navigation
Jump to search
(Delete * Spalten und Zeilen tauschen? * Units ans Ende der Tabelle? * statt dpm/g lieber dpm/kg?) |
m (Referenz) |
||
| Line 28: | Line 28: | ||
* Add a percent sign to the right of every percentage value | * Add a percent sign to the right of every percentage value | ||
* Write µg instead of microg | * Write µg instead of microg | ||
== References == | |||
* [Few 2004] Stephen Few, ''Show Me the Numbers: Designing Tables and Graphs to Enlighten''. Analytics Press, 2004, Chapter 8 - Table Design. | |||
== Links == | == Links == | ||
Revision as of 11:46, 29 November 2008
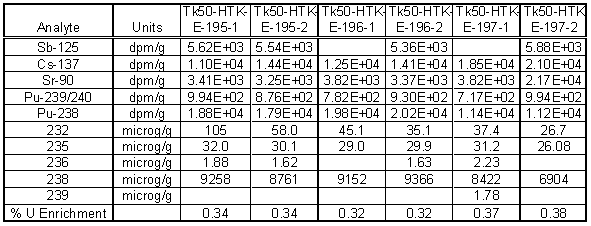
Original Table
Criticism
- Grid makes the data harder to read when scaning throug the colums and rows because it breaks up the data.
- The Border around the table is not needed since there is enough space around the table
- Rows and columns in the body stand to close togehter
- Text in the table is not aligned properly. Numbers should be aligned to the right because this makes them easier to read. The other Text not holding numbers such as the columns holding "Analyte" and "Units" should be aligned to the left
- Numbers are not in a consistent form. They have a different amount of digits after the decimal point. Other numbers are expressed in an exponential form
- The percent sign is missing for every percentage value
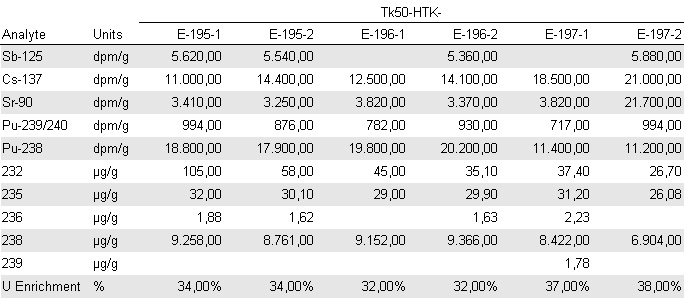
Optimized Table
Improvements
- Remove the grid. Use only a line to separate the header from the body
- Remove the border around the table
- Increase space between Rows and Columns
- Use categorical subdevision for TK50-HTK
- Separating the rows by shading them with a light gray.
- Add a point after three whole number digits
- Bring the numbers in a unique form. All numbers have the same amount of digits after the decimal point
- Align all numbers to the right and the other text to the left
- Add a percent sign to the right of every percentage value
- Write µg instead of microg
References
- [Few 2004] Stephen Few, Show Me the Numbers: Designing Tables and Graphs to Enlighten. Analytics Press, 2004, Chapter 8 - Table Design.

