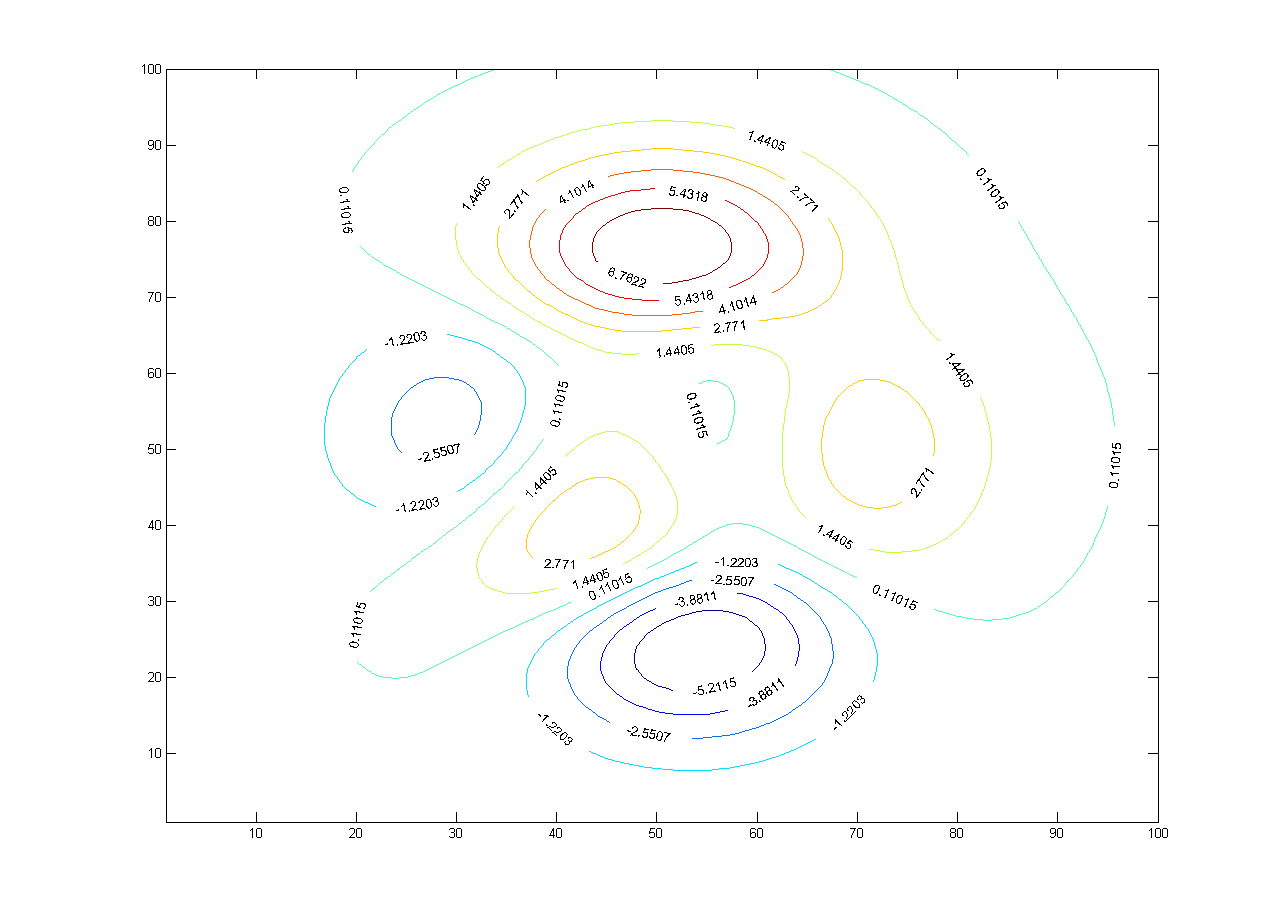
Teaching:TUW - UE InfoVis WS 2008/09 - Gruppe 08 - Aufgabe 1 - Contour Plot/Map

A contour plot (also contour map) is a graphic representation of the relationships among three numeric variables in two dimensions. Two variables are for X and Y axes, and a third variable Z is for contour levels. The contour levels are plotted as curves; the area between curves can be color coded to indicate interpolated values. [1]
Types of contour plots
References
- ↑ [SAS, 2008] SAS, SAS OnlineDoc. SAS. Retrieved at: October 29, 2008. http://support.sas.com/onlinedoc/913/getDoc/de/sgug.hlp/ctr_index.htm