Teaching:TUW - UE InfoVis WS 2008/09 - Gruppe 08 - Aufgabe 1 - Contour Plot/Map: Difference between revisions
Jump to navigation
Jump to search
m (neues Bild, Zitat, neue Quelle, Quellen anders referenziert) |
No edit summary |
||
| Line 1: | Line 1: | ||
== | ==Definitions== | ||
{{Quotation|A '''contour plot''' (also '''contour map''') is a graphic representation of the relationships among three numeric variables in two dimensions. Two variables are for X and Y axes, and a third variable Z is for contour levels. The contour levels are plotted as curves; the area between curves can be color coded to indicate interpolated values.|[SAS, 2008]}} | {{Quotation|A '''contour plot''' (also '''contour map''') is a graphic representation of the relationships among three numeric variables in two dimensions. Two variables are for X and Y axes, and a third variable Z is for contour levels. The contour levels are plotted as curves (also lines); the area between curves can be color coded to indicate interpolated values.|[SAS, 2008]}} | ||
{{Quotation|A '''contour line''' for a function of two variables is a curve connecting points where the function has a same particular value. ... The gradient of the function is always perpendicular to the contour lines. When the lines are close together the length of the gradient is large: the variation is steep. If adjacent contour lines are of the same line width, the direction of the gradient cannot be determined from the contour lines alone.|[AbAs, 2008]}} | |||
---- | ---- | ||
| Line 7: | Line 9: | ||
==Types of contour plots== | ==Types of contour plots== | ||
Contour plots are used for a wide range of applications. | |||
===Meteorology=== | ===Meteorology=== | ||
[[image:Weather_map.jpg|thumb|The map shows the analysis of the weather condition. The isobars represent lines of constant barometric pressure.]] | [[image:Weather_map.jpg|thumb|The map shows the analysis of the weather condition. The isobars represent lines of constant barometric pressure.]] | ||
Numerous weather stations measure different meteorological properties. The collected data just represent the local situation at the weather stations. Therefore contour lines are drawn to best approximate the locations of exact values, based on the scattered information points available. | |||
Contour lines in meteorological maps: | |||
* '''Barometric pressure''' (isobar) | |||
* '''Temperature''' (isotherm) | |||
* '''Precipitation and air moisture''' (isohyet and isohume) | |||
* '''Wind speed and direction''' (isotach and isogon) | |||
* '''Freeze and thaw''' (isotac) | |||
=== Physical geography and oceanography === | === Physical geography and oceanography === | ||
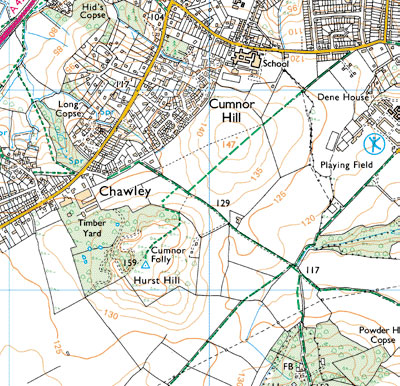
[[Image:Topographic_map.jpg|thumb]] | * '''Elevation and depth''' (topographic maps, bathymetric maps) [[Image:Topographic_map.jpg|thumb]] | ||
[[Image:Bathymetry.jpg|thumb|Ocean bottom topography, also known as bathymetry, is the measurement of the depth of large bodies of water.]] | [[Image:Bathymetry.jpg|thumb|Ocean bottom topography, also known as bathymetry, is the measurement of the depth of large bodies of water.]] | ||
* '''Magnetism''' | |||
* '''Oceanography''' | |||
=== Thermodynamics, engineering, and other sciences === | === Thermodynamics, engineering, and other sciences === | ||
* Social sciences | |||
* Thermodynamics, engineering, and other sciences | |||
* Other phenomena | |||
[[image:Contour_map.png|thumb|A contour map with contour lines.]] | [[image:Contour_map.png|thumb|A contour map with contour lines.]] | ||
| Line 33: | Line 51: | ||
==External links== | ==External links== | ||
* [http://www.bev.gv.at/ Bundesamt für Eich- und Vermessungswesen (Federal Office for | * [http://www.bev.gv.at/ Bundesamt für Eich- und Vermessungswesen (Federal Office for Meteorology and Surveying of Austria)] | ||
* [http://www.austrianmap.at/ Austrianmap] | * [http://www.austrianmap.at/ Austrianmap] | ||
* [http://www.zamg.ac.at/ Zentralanstalt für Meteorologie und Geodynamik] | * [http://www.zamg.ac.at/ Zentralanstalt für Meteorologie und Geodynamik] | ||
Revision as of 12:10, 31 October 2008
Definitions
A contour plot (also contour map) is a graphic representation of the relationships among three numeric variables in two dimensions. Two variables are for X and Y axes, and a third variable Z is for contour levels. The contour levels are plotted as curves (also lines); the area between curves can be color coded to indicate interpolated values.
[SAS, 2008]
A contour line for a function of two variables is a curve connecting points where the function has a same particular value. ... The gradient of the function is always perpendicular to the contour lines. When the lines are close together the length of the gradient is large: the variation is steep. If adjacent contour lines are of the same line width, the direction of the gradient cannot be determined from the contour lines alone.
[AbAs, 2008]
Types of contour plots
Contour plots are used for a wide range of applications.
Meteorology

Numerous weather stations measure different meteorological properties. The collected data just represent the local situation at the weather stations. Therefore contour lines are drawn to best approximate the locations of exact values, based on the scattered information points available.
Contour lines in meteorological maps:
- Barometric pressure (isobar)
- Temperature (isotherm)
- Precipitation and air moisture (isohyet and isohume)
- Wind speed and direction (isotach and isogon)
- Freeze and thaw (isotac)
Physical geography and oceanography
- Elevation and depth (topographic maps, bathymetric maps)


- Magnetism
- Oceanography
Thermodynamics, engineering, and other sciences
- Social sciences
- Thermodynamics, engineering, and other sciences
- Other phenomena

References
- [SAS, 2008] SAS OnlineDoc, SAS. Retrieved at: October 29, 2008. http://support.sas.com/onlinedoc/913/getDoc/de/sgug.hlp/ctr_index.htm
- [AbAs, 2008] Absolute Astronomy. Retrieved at: October 31, 2008. http://www.absoluteastronomy.com/
- [Wiki, 2008] Contour line, Wikipedia. Retrieved at: October 30, 2008. http://en.wikipedia.org/wiki/Contour_map