Teaching:TUW - UE InfoVis WS 2008/09 - Gruppe 01 - Aufgabe 1 - Cartogram: Difference between revisions
mNo edit summary |
mNo edit summary |
||
| Line 15: | Line 15: | ||
Different to the non-continuous cartograms, the important point is that the regions in the map are connected to each other. Accordingly the shape of each region is changing their size. Therefore the outline of the hole map changes. As we can see in the picture below, France is very distorted but still connected to his neighbors. With changing the shape of this country, the outlines of the whole map has changed. | Different to the non-continuous cartograms, the important point is that the regions in the map are connected to each other. Accordingly the shape of each region is changing their size. Therefore the outline of the hole map changes. As we can see in the picture below, France is very distorted but still connected to his neighbors. With changing the shape of this country, the outlines of the whole map has changed. | ||
[[image:europe.jpg|center]] | [[image:europe.jpg|center]] | ||
* Perimeter-Preserving Cartograms | |||
In this version the outline of the map is the same as in the original image. The regions in it are still connected to each other, so the only change is the border of the regions which is moving but still connected to his neighbors. | |||
Revision as of 16:43, 3 November 2008
Cartogram
Definition
A Cartogram is a small diagram, on the face of a map, showing quantitative information or an abstracted and simplified map the base of which is not true to scale. Simply we can say cartograms are unique representations of geographical space. They use cartographic outlines to represent data which depends on this source.
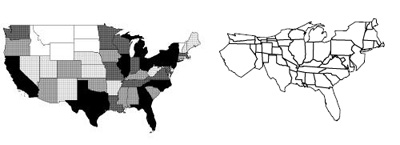
On the left side you can see a traditional map of the United states and on the right side a Cartogram of USA depending on the population density.
Types of Cartograms
- Non-Continuous Cartograms
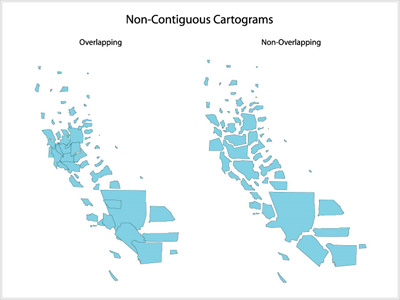
In non-continuous cartograms the regions on the map don't have to be connected to their neighbors. In this type of cartogram it is important to see the shape of the original map. User will recognize the map just because of their borders. The regions in the map are displaying the content with their own size. For an example a region with a smaller population will be smaller than a sector with a higher population.

- Continuos Cartograms
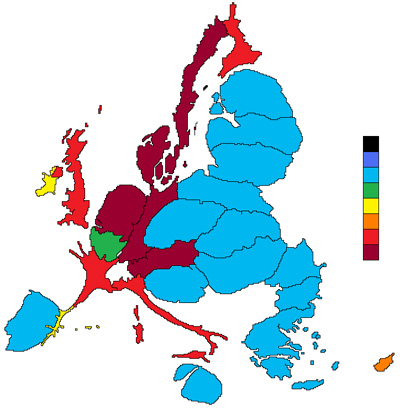
Different to the non-continuous cartograms, the important point is that the regions in the map are connected to each other. Accordingly the shape of each region is changing their size. Therefore the outline of the hole map changes. As we can see in the picture below, France is very distorted but still connected to his neighbors. With changing the shape of this country, the outlines of the whole map has changed.

- Perimeter-Preserving Cartograms
In this version the outline of the map is the same as in the original image. The regions in it are still connected to each other, so the only change is the border of the regions which is moving but still connected to his neighbors.
