Teaching:TUW - UE InfoVis WS 2007/08 - Gruppe 07 - Aufgabe 4: Difference between revisions
Jump to navigation
Jump to search
No edit summary |
No edit summary |
||
| Line 5: | Line 5: | ||
[[Image:20070920_blutuntersuchung.jpg]] | [[Image:20070920_blutuntersuchung.jpg]] | ||
== Analysis of the application area == | |||
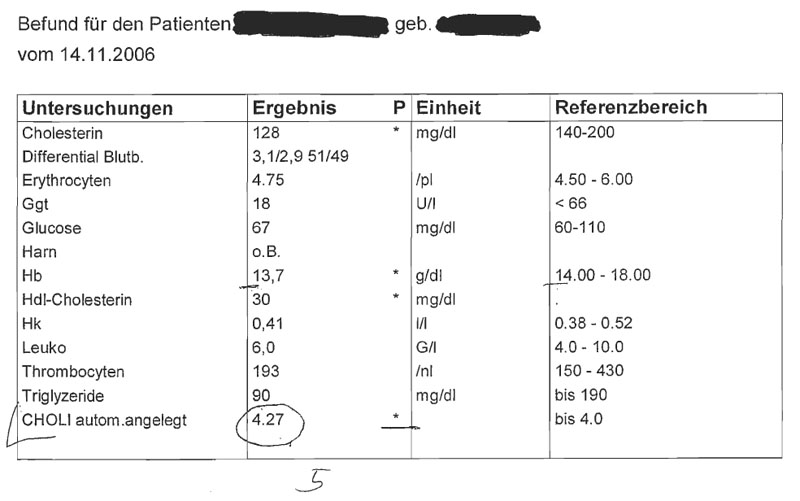
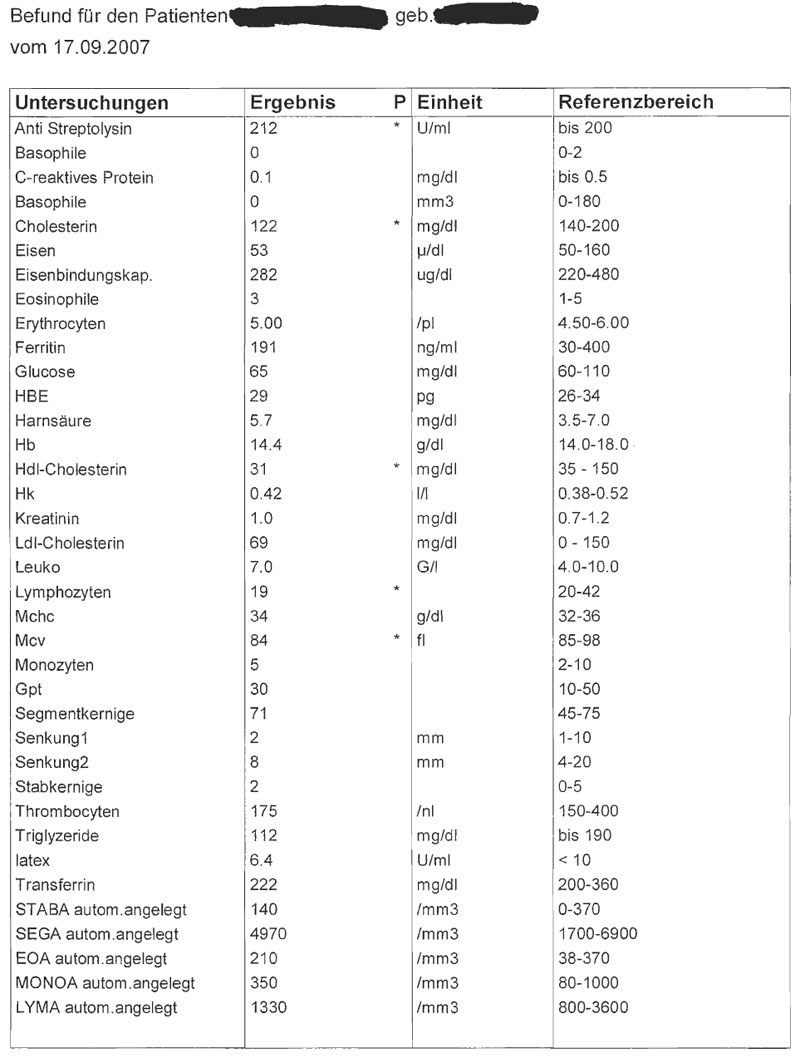
Our sample data belong into the medical field of application. They are diagnostic findings which are basically sets of multiple tests that play a supportive role in doctors' decisions about the diagnosis. | |||
<br/><br/><br/><br/><br/><br/><br/><br/><br/><br/><br/><br/><br/><br/><br/><br/><br/><br/><br/><br/><br/><br/><br/><br/> | <br/><br/><br/><br/><br/><br/><br/><br/><br/><br/><br/><br/><br/><br/><br/><br/><br/><br/><br/><br/><br/><br/><br/><br/> | ||
Revision as of 16:23, 2 January 2008
Assignment description
Description of the fourth task
Assigned data / model
Analysis of the application area
Our sample data belong into the medical field of application. They are diagnostic findings which are basically sets of multiple tests that play a supportive role in doctors' decisions about the diagnosis.
XXX REMOVE FROM HERE XXX
Aufgabenstellung
Aufgabe ist das Design einer interaktiven Visualisierungsapplikation zur Darstellung und Exploration
(des zeitlichen Verlaufs) von Laborwerten einer Blutuntersuchung. BenutzerInnen, Einsatzzweck, Tasks, etc.
sollen von Euch selbst festgelegt und beschrieben werden.
Beispiele für derartige Datensätze
XXX REMOVE TO HERE XXX

