Teaching:TUW - UE InfoVis WS 2007/08 - Gruppe 05 - Aufgabe 4
Aufgabenstellung
Aufgabe ist das Design einer interaktiven Visualisierungsapplikation zur Darstellung und Exploration
(des zeitlichen Verlaufs) von Laborwerten einer Blutuntersuchung. BenutzerInnen, Einsatzzweck, Tasks, etc.
sollen von Euch selbst festgelegt und beschrieben werden.
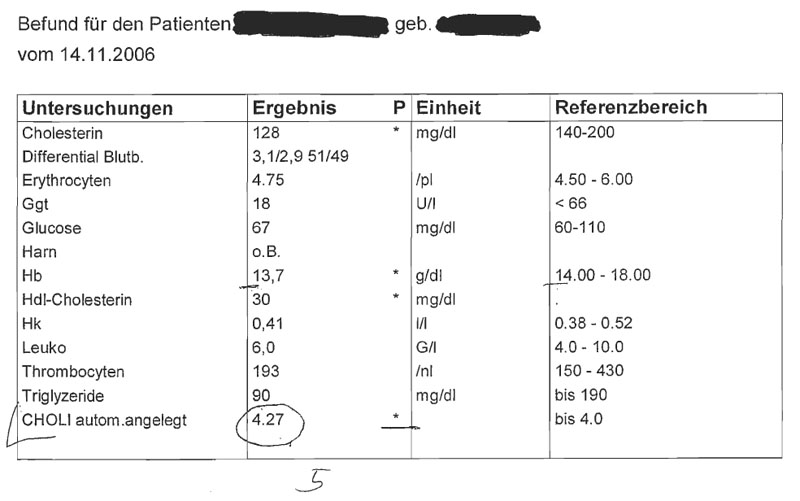
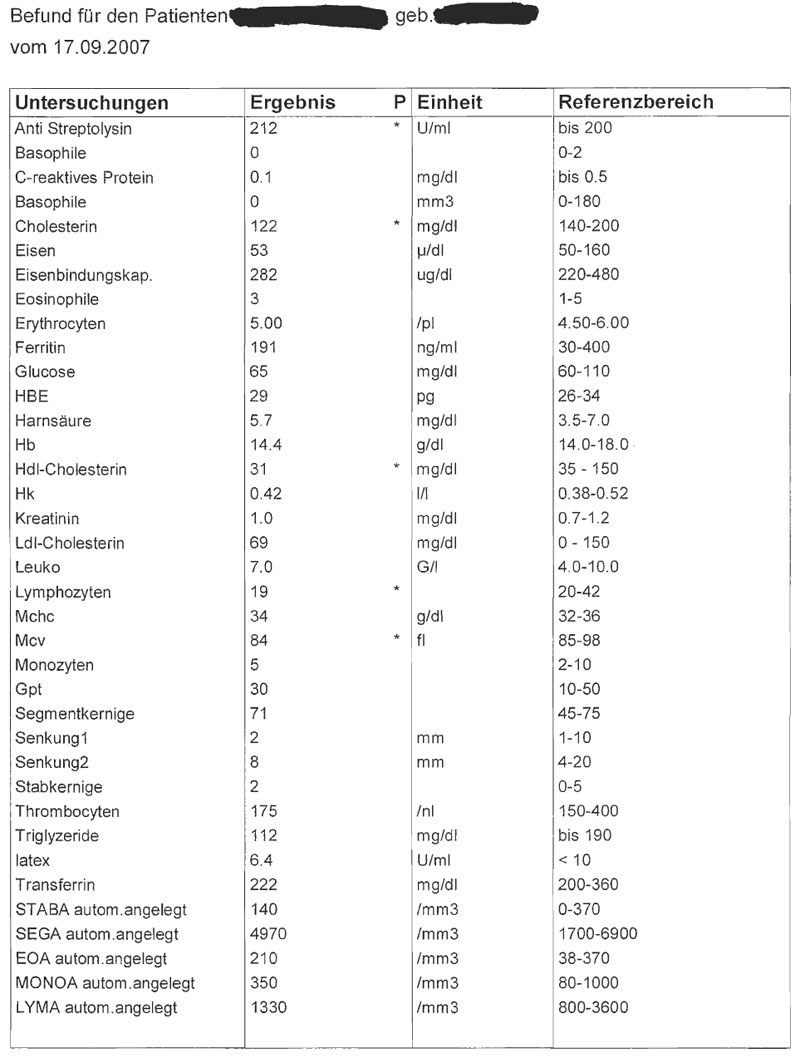
Beispiele für derartige Datensätze
Target exploration
Target and dataset description
field of appliation
This visualization is used in a medical environment to show the different results of blood examinations over time. It's important to highlight values, which are not in the "normal" range, so that you can recognize those values at a glance. It's possible to measure different values at every blood test. Thereby the structure of the datasets can be different for every blood test. The datasets are usually very big and are very complex to analyze.

