Teaching:TUW - UE InfoVis WS 2006/07 - Gruppe 08 - Aufgabe 3 - Prototype: Difference between revisions
No edit summary |
|||
| Line 10: | Line 10: | ||
The actual implementation used the provided GridLayout class for positioning the individual data points. Prefuse's GridLayout ensures that one specific person will always be positioned in the same row. | The actual implementation used the provided GridLayout class for positioning the individual data points. Prefuse's GridLayout ensures that one specific person will always be positioned in the same row. | ||
For the desired interaction prefuse's BifocalDistortion class was used. It handles expanding and compressing the displayed data interactively. | For the desired interaction prefuse's BifocalDistortion class was used. It handles expanding and compressing the displayed data interactively. | ||
First we tried to use ''LabelRenderer'' for the datapoints, but it turned out useless because with more data the labels were overlapping massively. Therefore we switched to ''ShapeRenderer'' - ie each datapoint is represented by a tiny square (or other shape) - and the desired information (which person is behind the datapoint) shows up as ''ToolTip'' on hover. | |||
=== Screenshot === | === Screenshot === | ||
Revision as of 00:02, 12 January 2007
Perspective Wall
Author
Matej Durco
Project description
We set out to implement a specific type of bifocal display called "Perspective Wall" [MayKinlay et al., 1991] using the comprehensive prefuse toolkit. Prefuse provides extensive methods for visualising data. While its main focus is implementing graphs it is also possible to implement time-based visualisation methods.
Our solution was originally meant to use a person's diary or, more specifically, records of other people the person met as its data source. The rows would represent individual people while the x-axis would represent time units as identified in the data. It should be possible to move backwards and forwards in time while at the same time zooming into a specific area of interest.
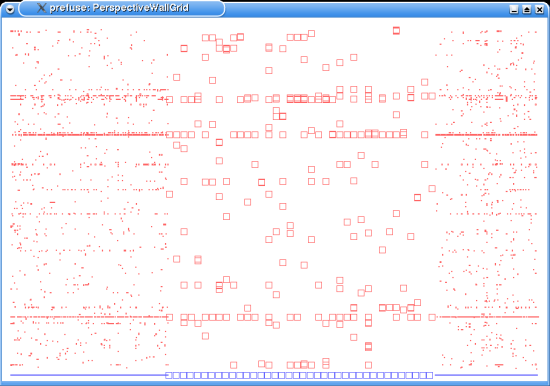
The actual implementation used the provided GridLayout class for positioning the individual data points. Prefuse's GridLayout ensures that one specific person will always be positioned in the same row. For the desired interaction prefuse's BifocalDistortion class was used. It handles expanding and compressing the displayed data interactively.
First we tried to use LabelRenderer for the datapoints, but it turned out useless because with more data the labels were overlapping massively. Therefore we switched to ShapeRenderer - ie each datapoint is represented by a tiny square (or other shape) - and the desired information (which person is behind the datapoint) shows up as ToolTip on hover.
Screenshot
References
- [Mackinlay et al., 1991] Mackinlay, J. D., Robertson, G. G., and Card, S. K.: The Perspective Wall: Detail and Context Smoothly Integrated. In Proceedings of ACM Conference on Human Factors in Computing Systems (CHI91), Information Visualization, pages 173–179, 1991. http://ieg.ifs.tuwien.ac.at/~aigner/teaching/infovis_ue/papers/p173-mackinlay_perspective_wall.pdf
- Prefuse Toolkit http://prefuse.org/
