Teaching:TUW - UE InfoVis WS 2006/07 - Gruppe 03 - Aufgabe 1 - InfoZoom
Definition
InfoZoom is an application, developed by the company humanIT a spin-off of Fraunhofer Society, for analyzing and displaying large amounts of data in an easy-to-understand format.
History
InfoZoom evolved from another system called FOCUS, a focus+context table layout [Kort].
Overview
Primary, InfoZoom was developed for manipulating tables, it uses parallel bargrams for larger set sizes and focus+context tables for smaller ones [Wittenburg]. In InfoZoom it is possible to present information in table or distribution oriented formats. The data can be sorted sequential, hierarchical or in any way the user wants it to be sorted [Mark, 2003]. If necessary the user can "zoom" into information by doubleclicking on attribute values or sets/ranges of values.
Description
Data source
The user can import data either with the import tool for Excel or text files or use an ODBC or OLE DB connection.
View Modes
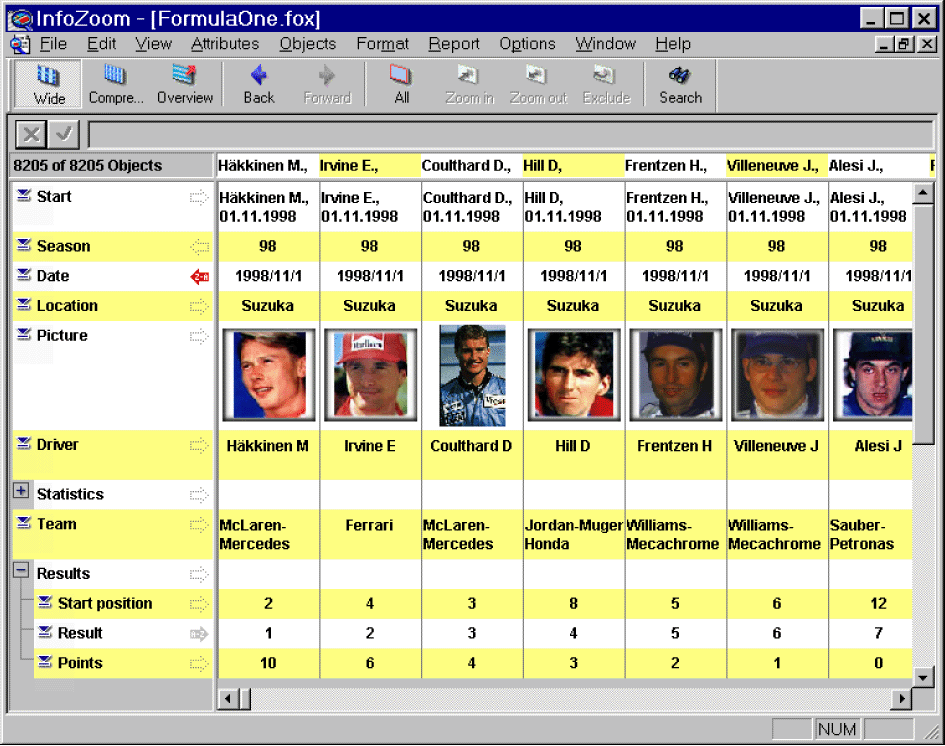
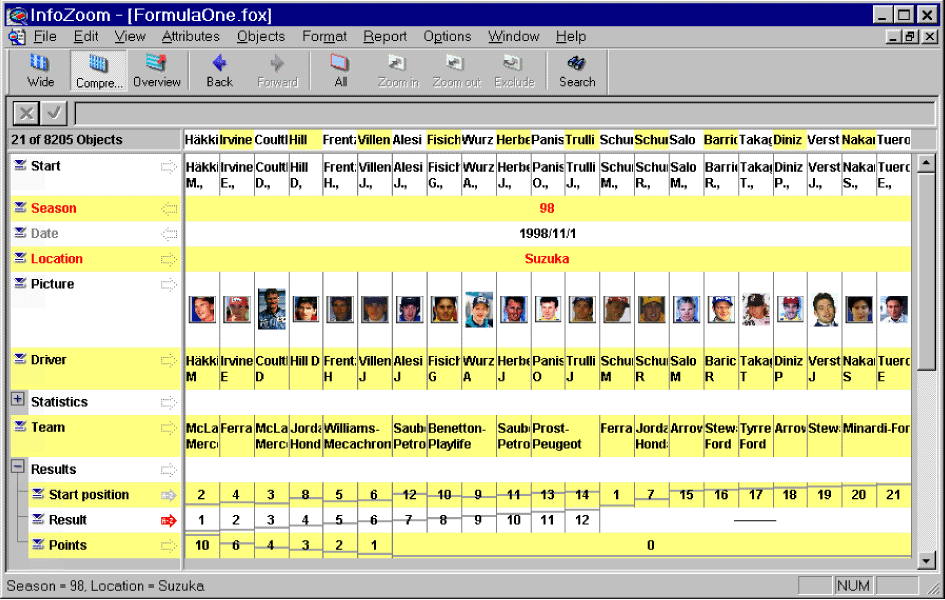
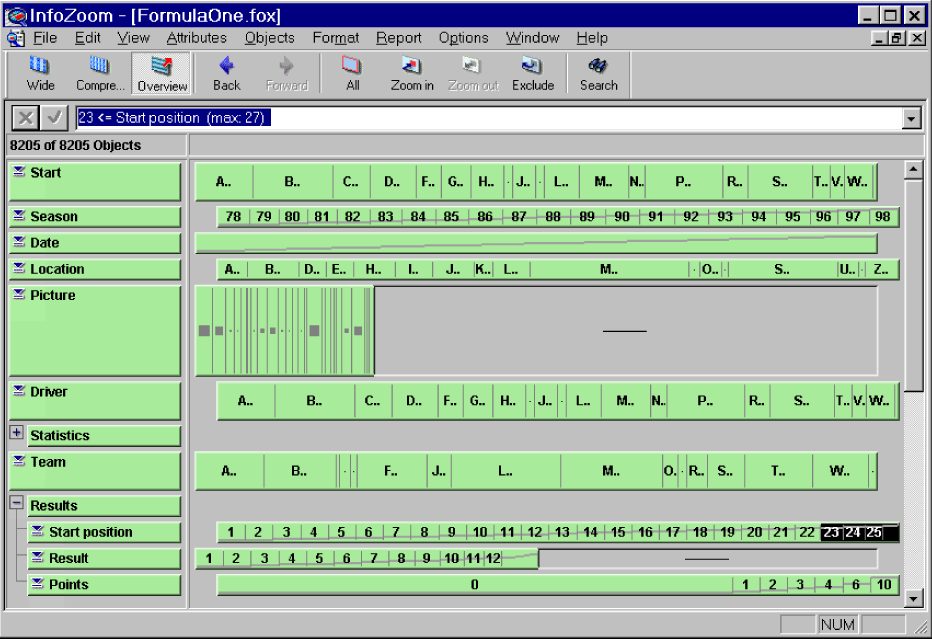
InfoZoom offers three modes for data analysis: wide table, compressed table and overview
Wide Table
The wide table looks like a table we know from spreadsheets or database tables. Every attribute is shown as a row and the objects as columns. If the windows is not big enough to show all records or attributes you can scroll vertically or horizontally
Compressed Table
The compressed table shows all objects pushed together to fit on the screen. Numerical values are represented by the vertical position of dots. The data can be sorted by individual attributes in ascending or descendig order.
Overview Mode
The overview mode allows that the content of each attributes row are sorted independently. The identical values are placed together in a cell. The width of the cell represents the frequency of this value.
Filter
With filter the user can search data or find patterns in a dataset. You can search after a specific value or value range on an attribute.
Derived Attribute
The user can combine attributes with derived attributes. The new value is calculated from the values of one or two already existing attributes.
Graphics Report
Graphic Reports can be created with different styles, e.g. Pie, Donut, Bar, Horiz Bar, Line, Area, Point, Bubble, Volume, ...
Use
InfoZoom is often used for Visual Data Mining (VDM), a process which aims at the recognition of patterns in data by an human expert. VDM makes use of an technique called focus+context. Here, it's possible for the expert to show focused and contextual information at the same time. [Kort]
References
[Spenke, 2000] Michael Spenke and Christian Beilken, InfoZoom - Analysing Formula One Racing Results With an Interactive Data Mining and Visualisation Tool, Second Conference on Data Mining 2000; URL: http://www.ifs.tuwien.ac.at/~silvia/wien/vu-infovis/articles/spenke00infozoom.pdf
[humanIT, 2006] Author unkonwon: InfoZoom; humanIT Software GmbH; Access Date: 30 Oct 2006; URL: http://www.infozoom.com/enu/infozoom/index.htm
[Xie, 2006] Zaixian Xie: Review on InfoZoom; Worcester Polytechnic Insitute: Course Data Visualization; Creation Date: 1. Feb. 2006 Access date: 30. Oct. 2006; URL: http://users.wpi.edu/~xiezx/courses/cs525d/infozoom/infozoom.htm


