Teaching:TUW - UE InfoVis WS 2005/06 - Gruppe G4 - Aufgabe 2: Difference between revisions
Jump to navigation
Jump to search
No edit summary |
|||
| Line 1: | Line 1: | ||
== Poor Graphic == | == Poor Graphic == | ||
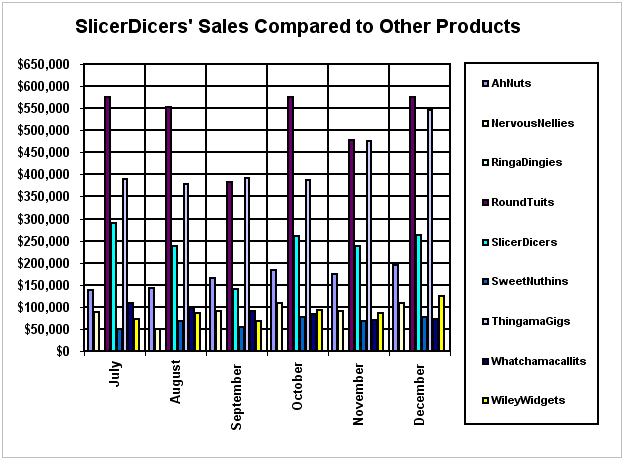
[[Image:Perceptualedge03slicerdicer.gif|none|thumb|600px|SlicerDicer's Sales Compared to Other Products (click on image for larger version)]] | [[Image:Perceptualedge03slicerdicer.gif|none|thumb|600px|SlicerDicer's Sales Compared to Other Products (click on image for larger version)]] | ||
Here we have got an example for a low data-ink ratio. The data-ink ratio is the proportion of the ink that is used to present actual data, without redundancy, compared to the total amount of int used in the entire display. The goal is to receive the highest possible data-ink ration (a value close to 1.0 or 100%). | |||
The data-ink ratio is defined as the percentage: (100*data-ink)/(total ink used on the graph) | |||
Revision as of 11:04, 31 October 2005
Poor Graphic

Here we have got an example for a low data-ink ratio. The data-ink ratio is the proportion of the ink that is used to present actual data, without redundancy, compared to the total amount of int used in the entire display. The goal is to receive the highest possible data-ink ration (a value close to 1.0 or 100%). The data-ink ratio is defined as the percentage: (100*data-ink)/(total ink used on the graph)